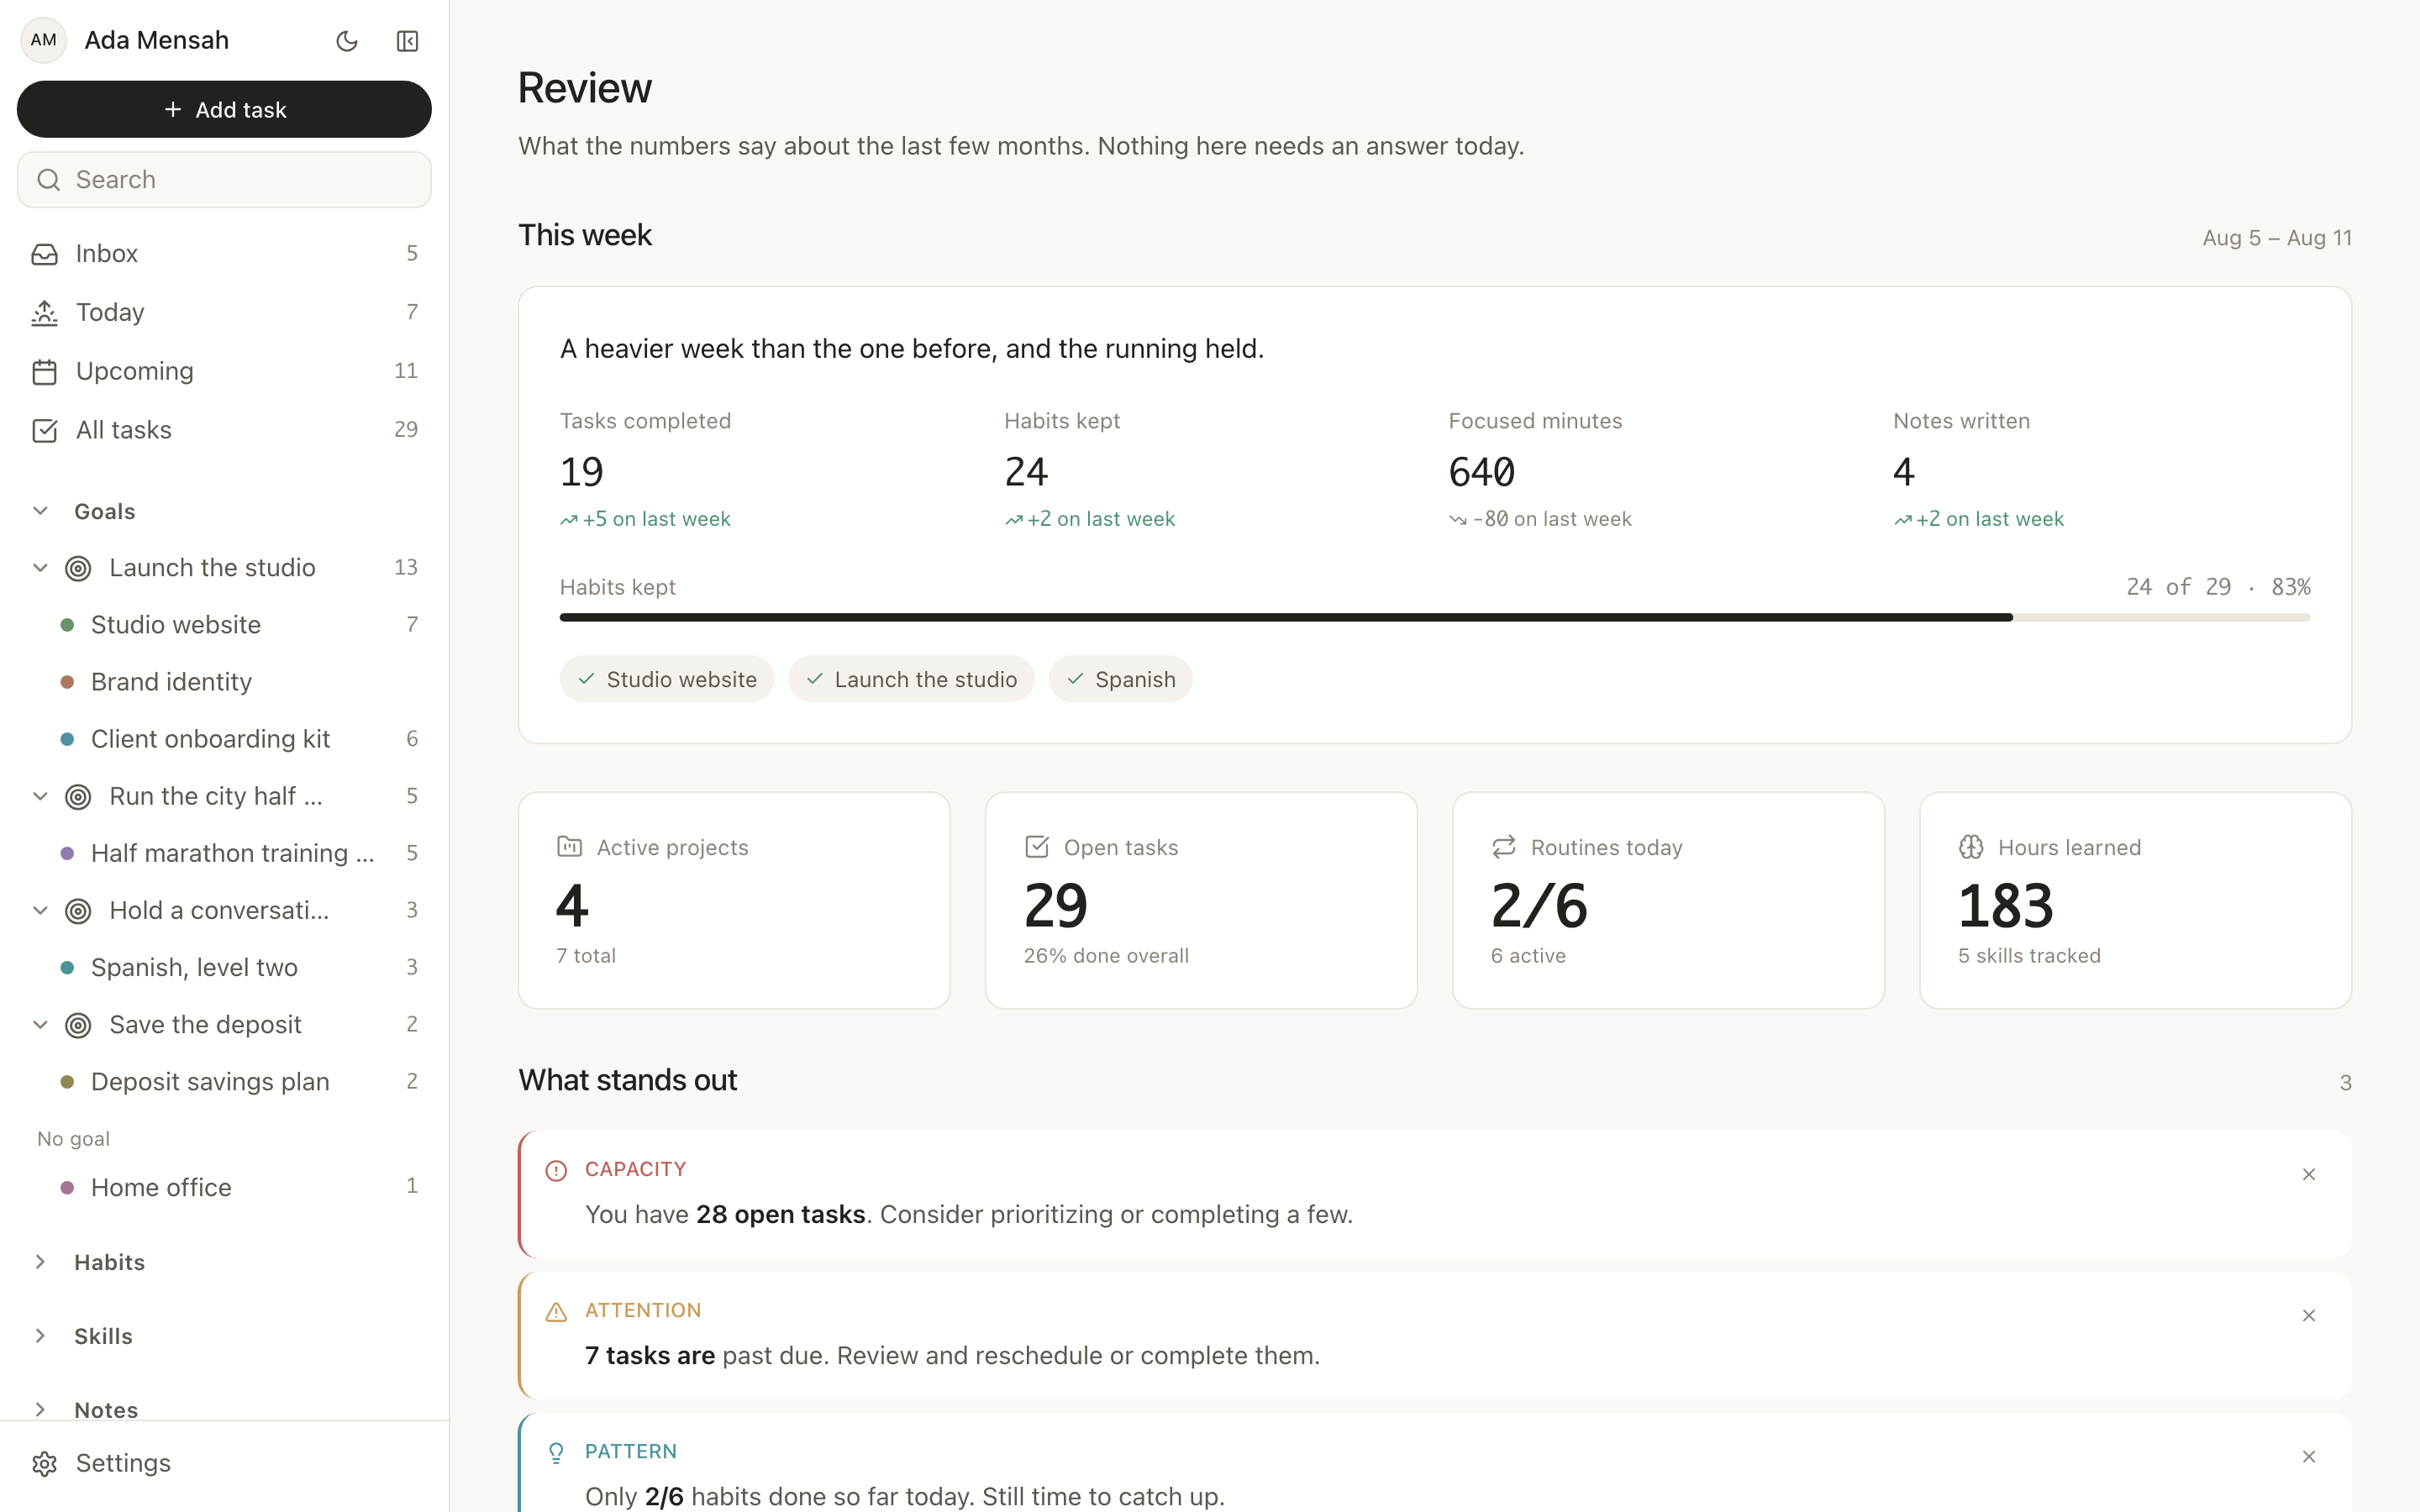
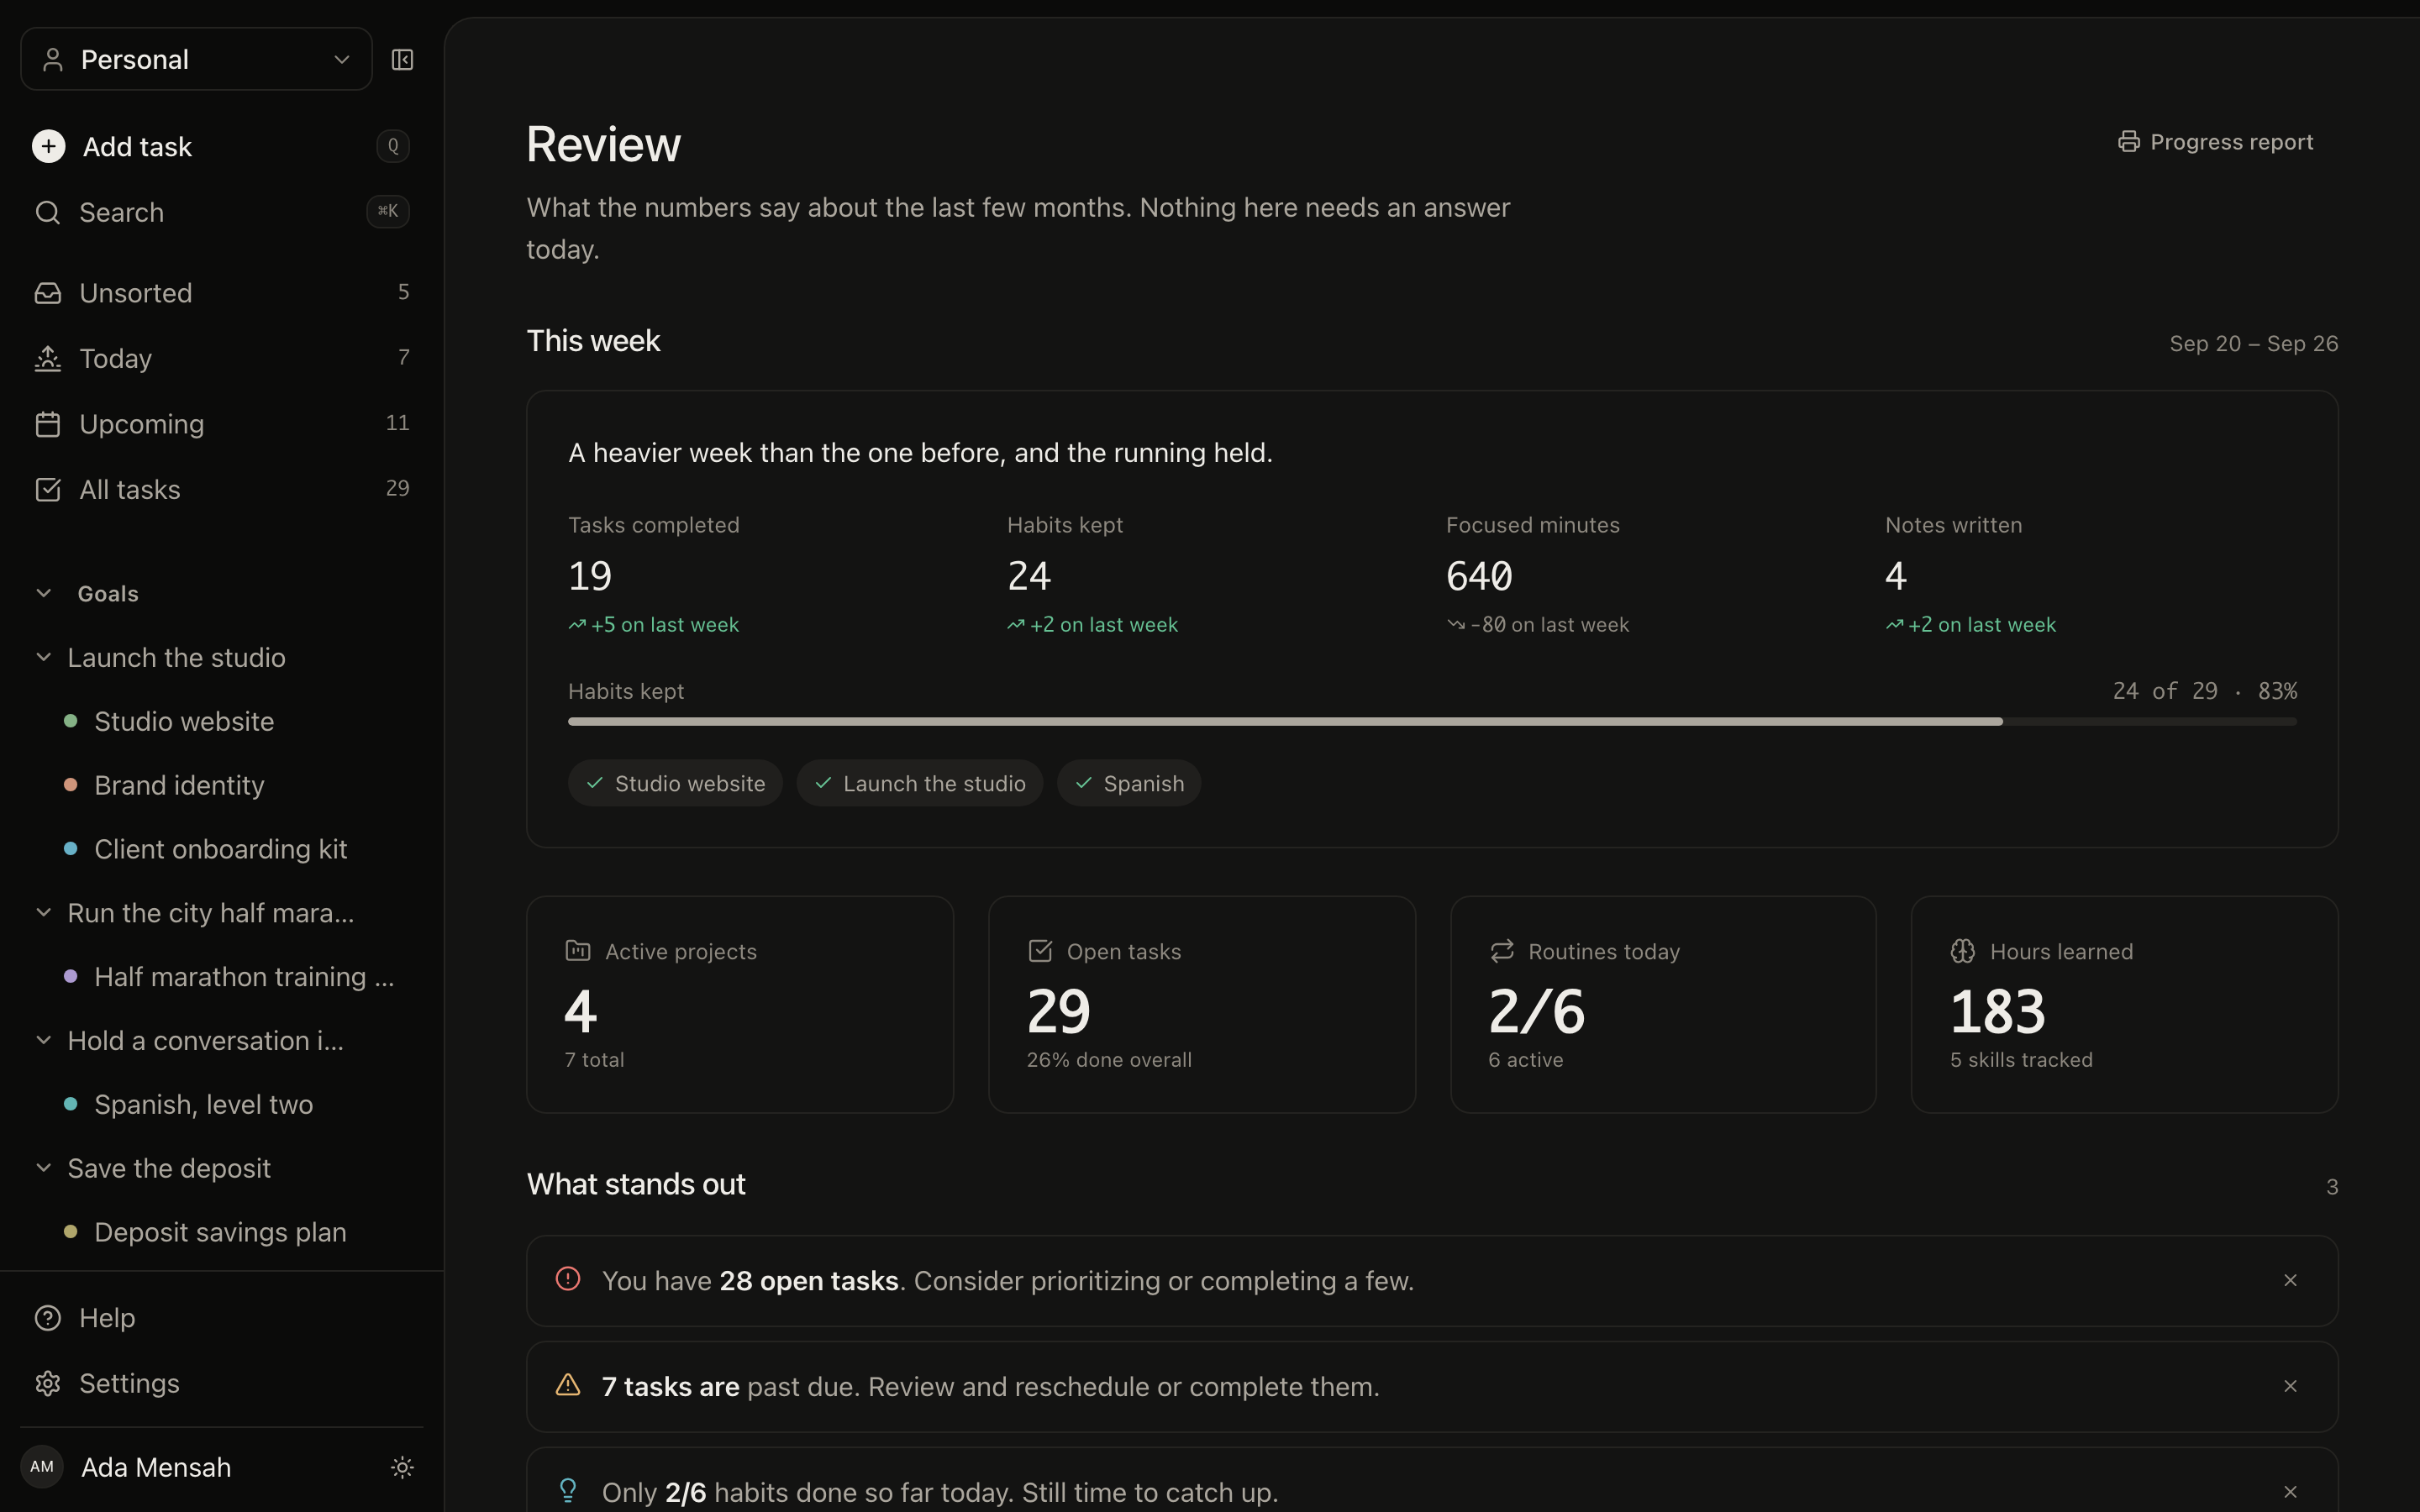
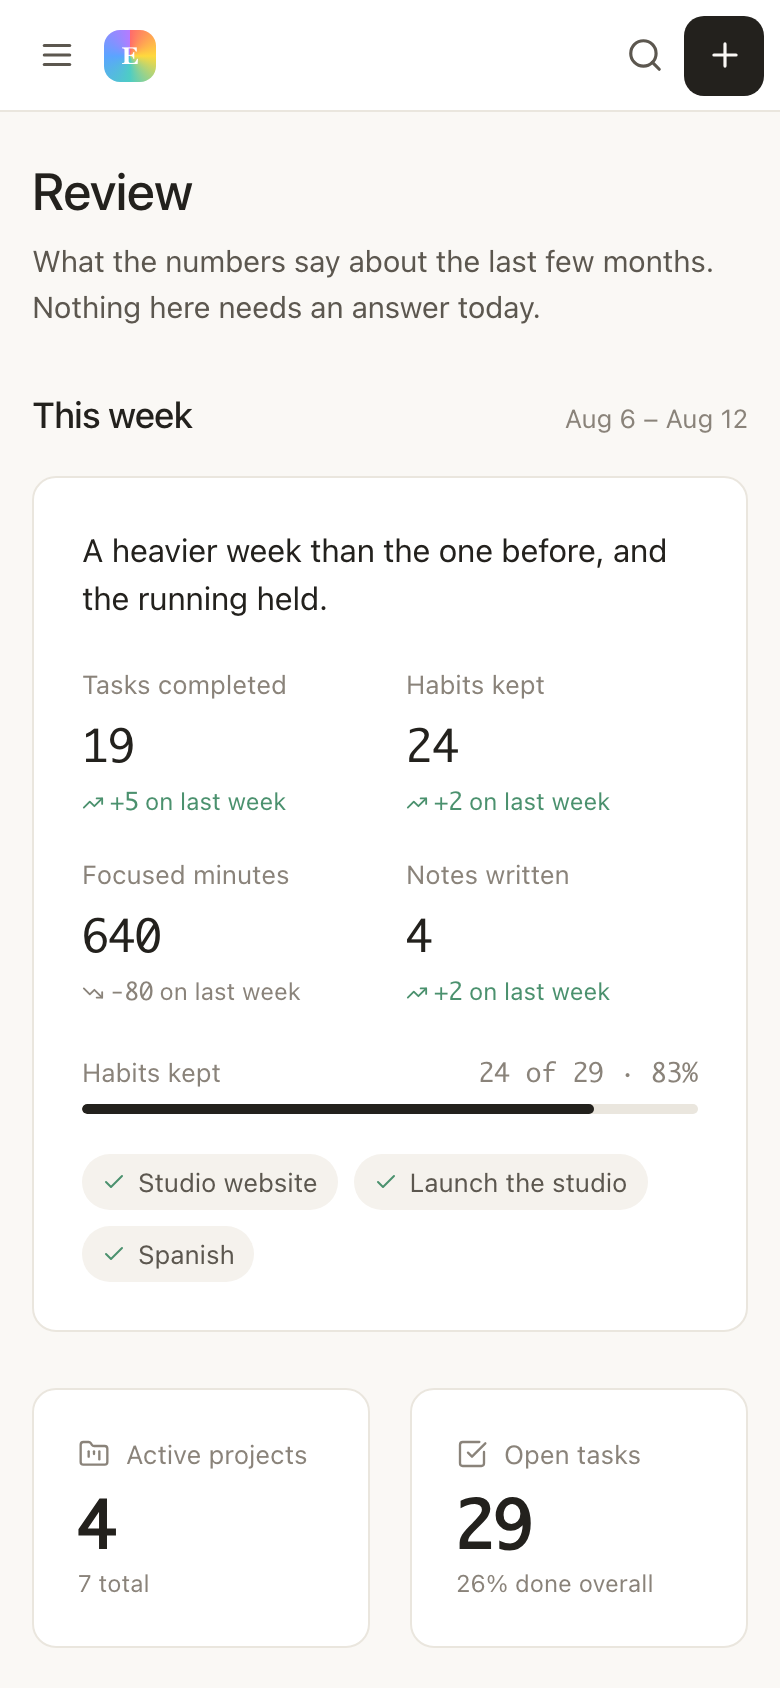
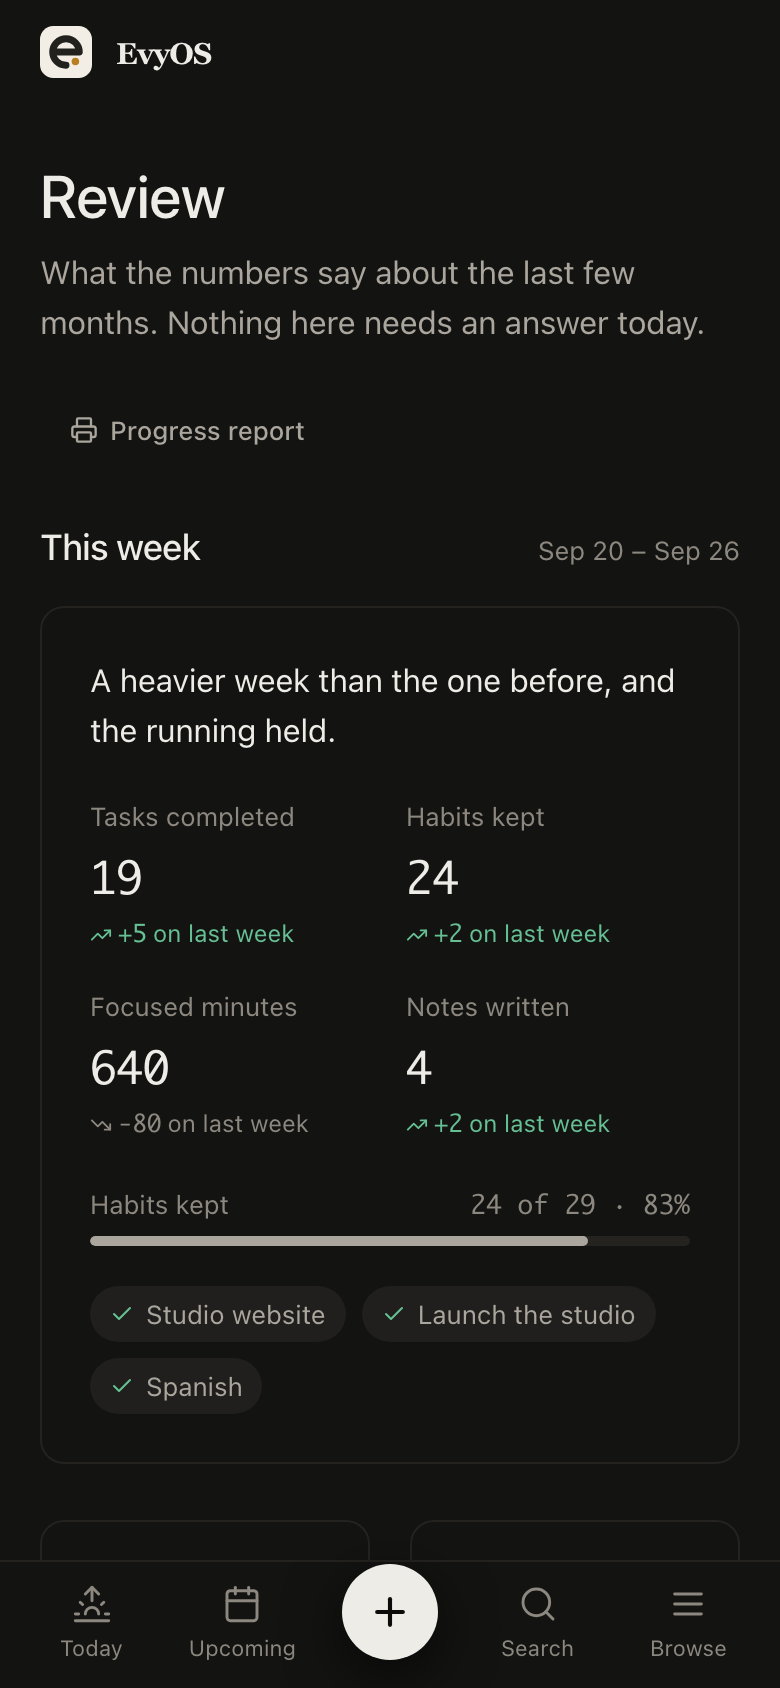
At the end of a quarter, most people can describe how hard they worked and not what moved. EvyOS keeps goals, projects, tasks, habits and skills in one system, so the dashboard can answer that from work you already did rather than a survey you have to fill in.
The dashboard and the weekly summary are on the free plan.
Nothing here is a separate thing to maintain. The dashboard reads the seven record types you already use, which is the whole argument for keeping them in one app rather than five.
How much you finished, week by week. Useful less as a score than as a shape: the flat stretches usually have a reason, and the reason is usually visible next to them.
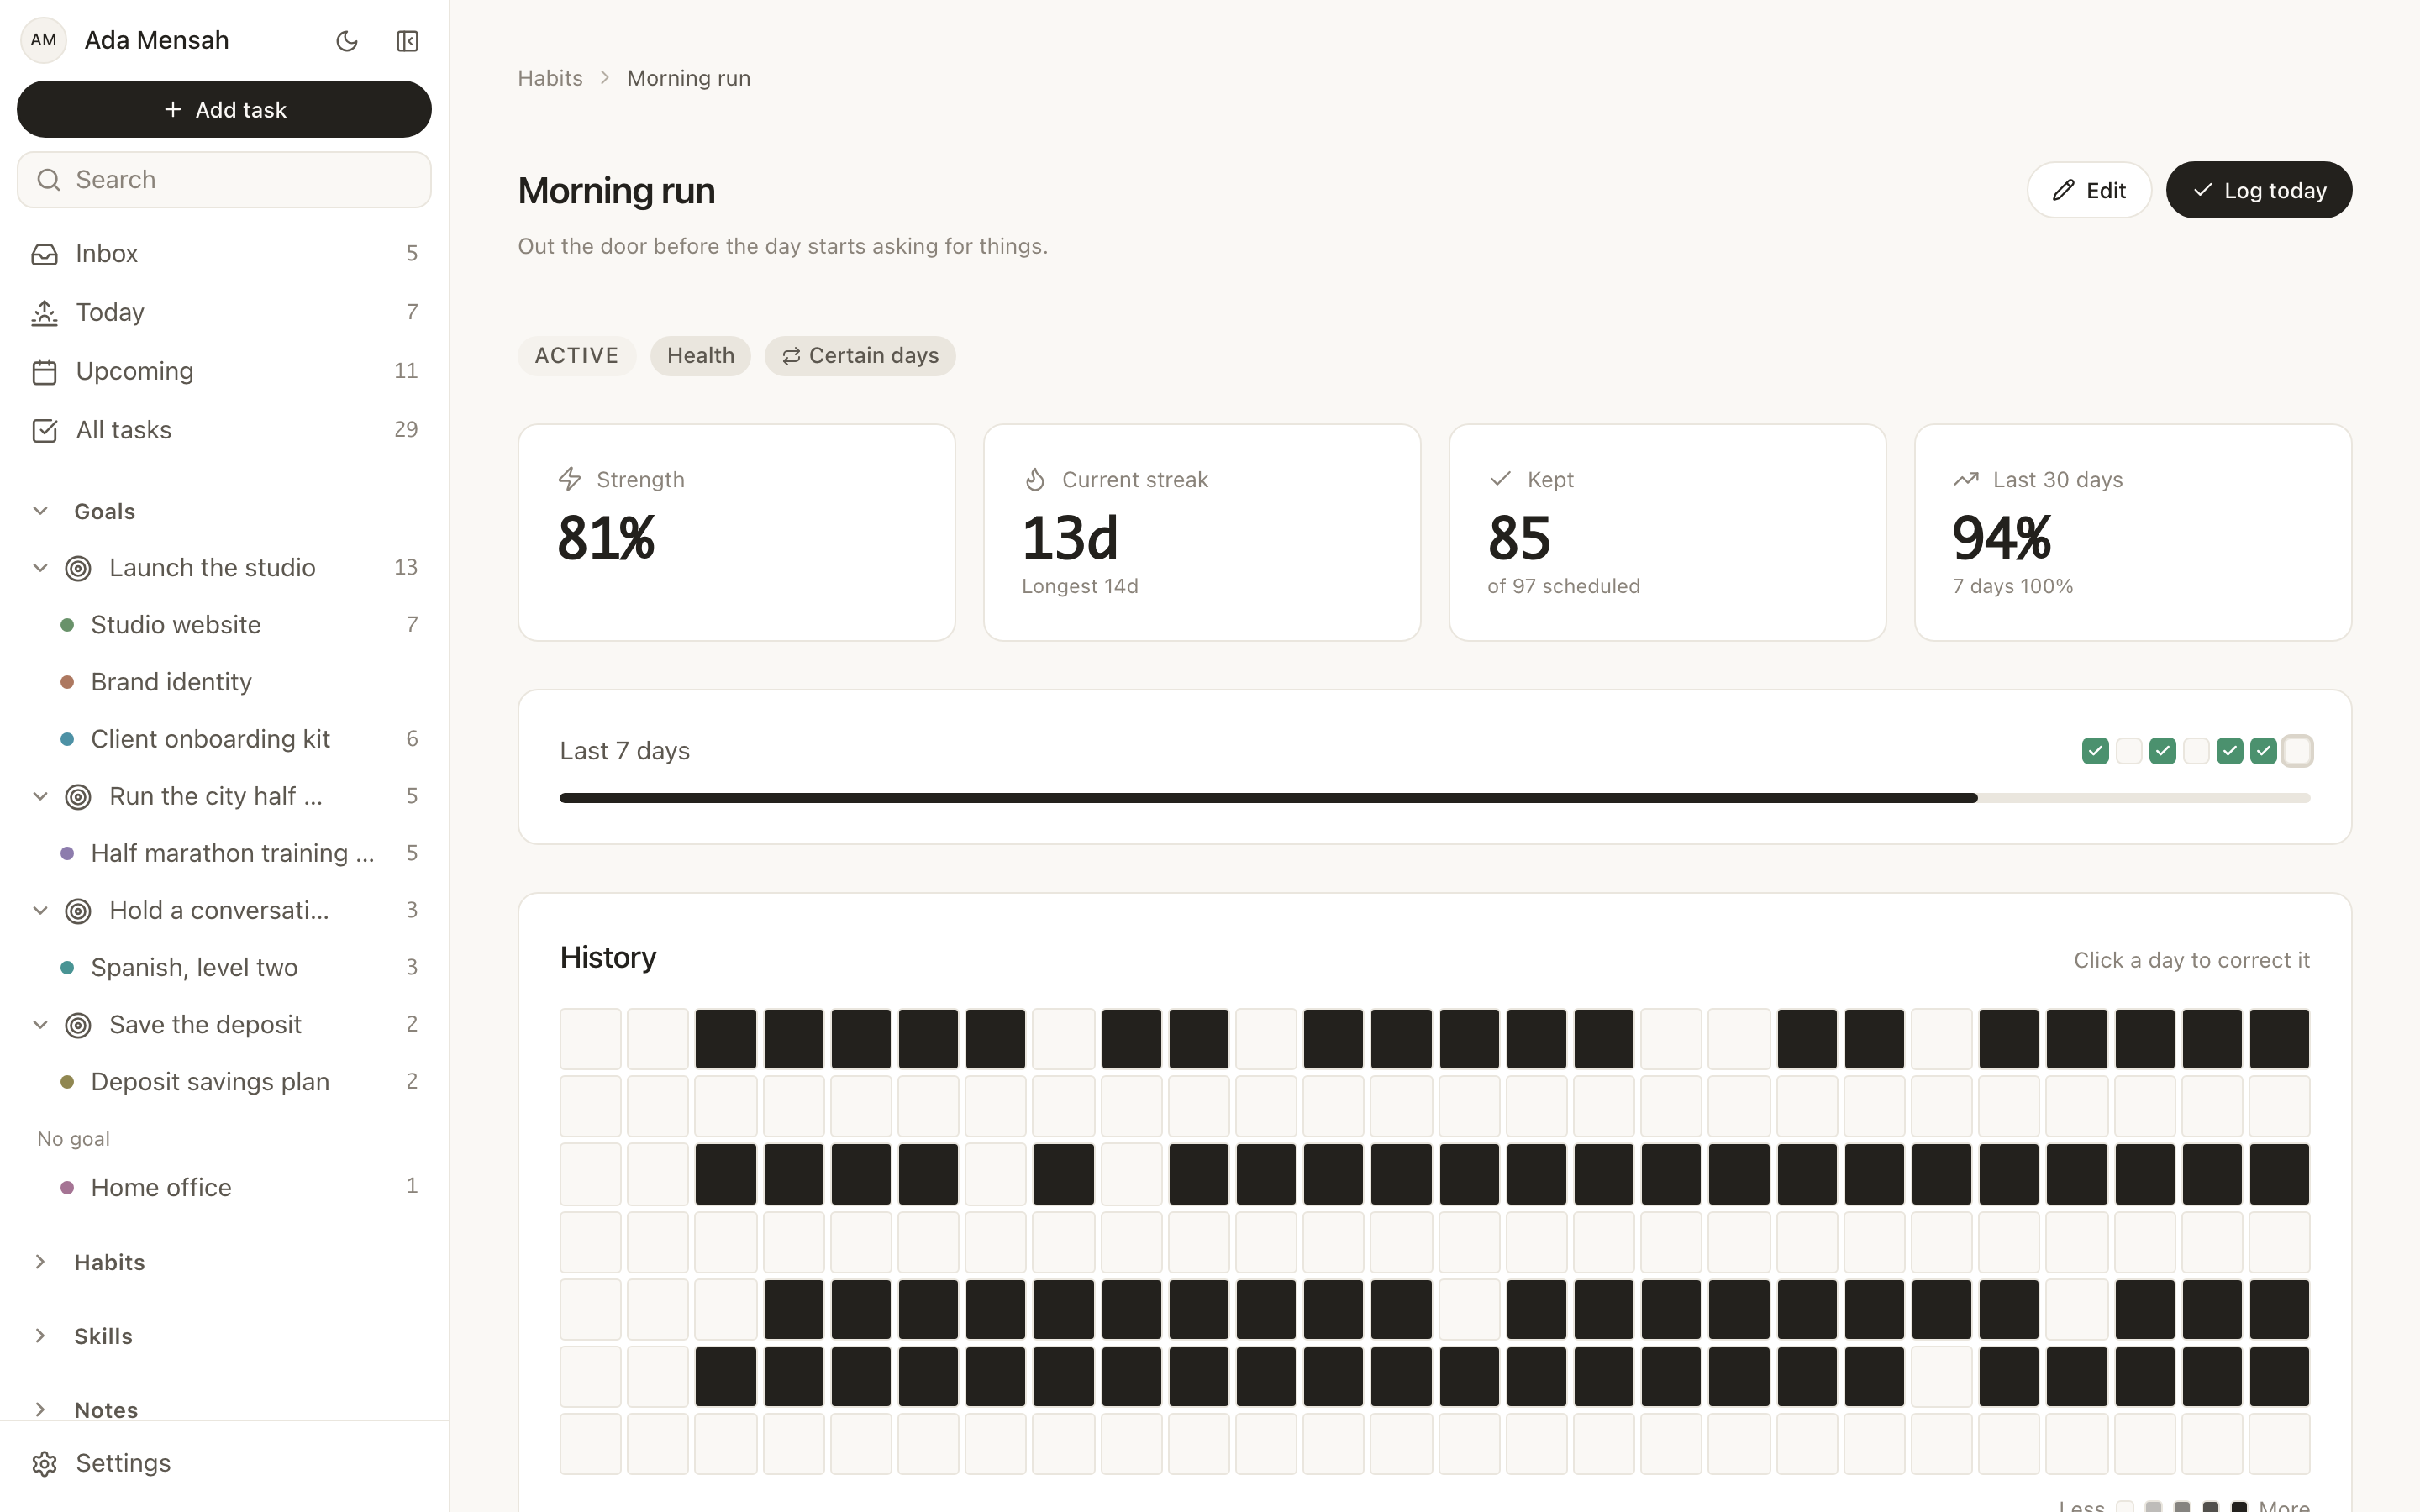
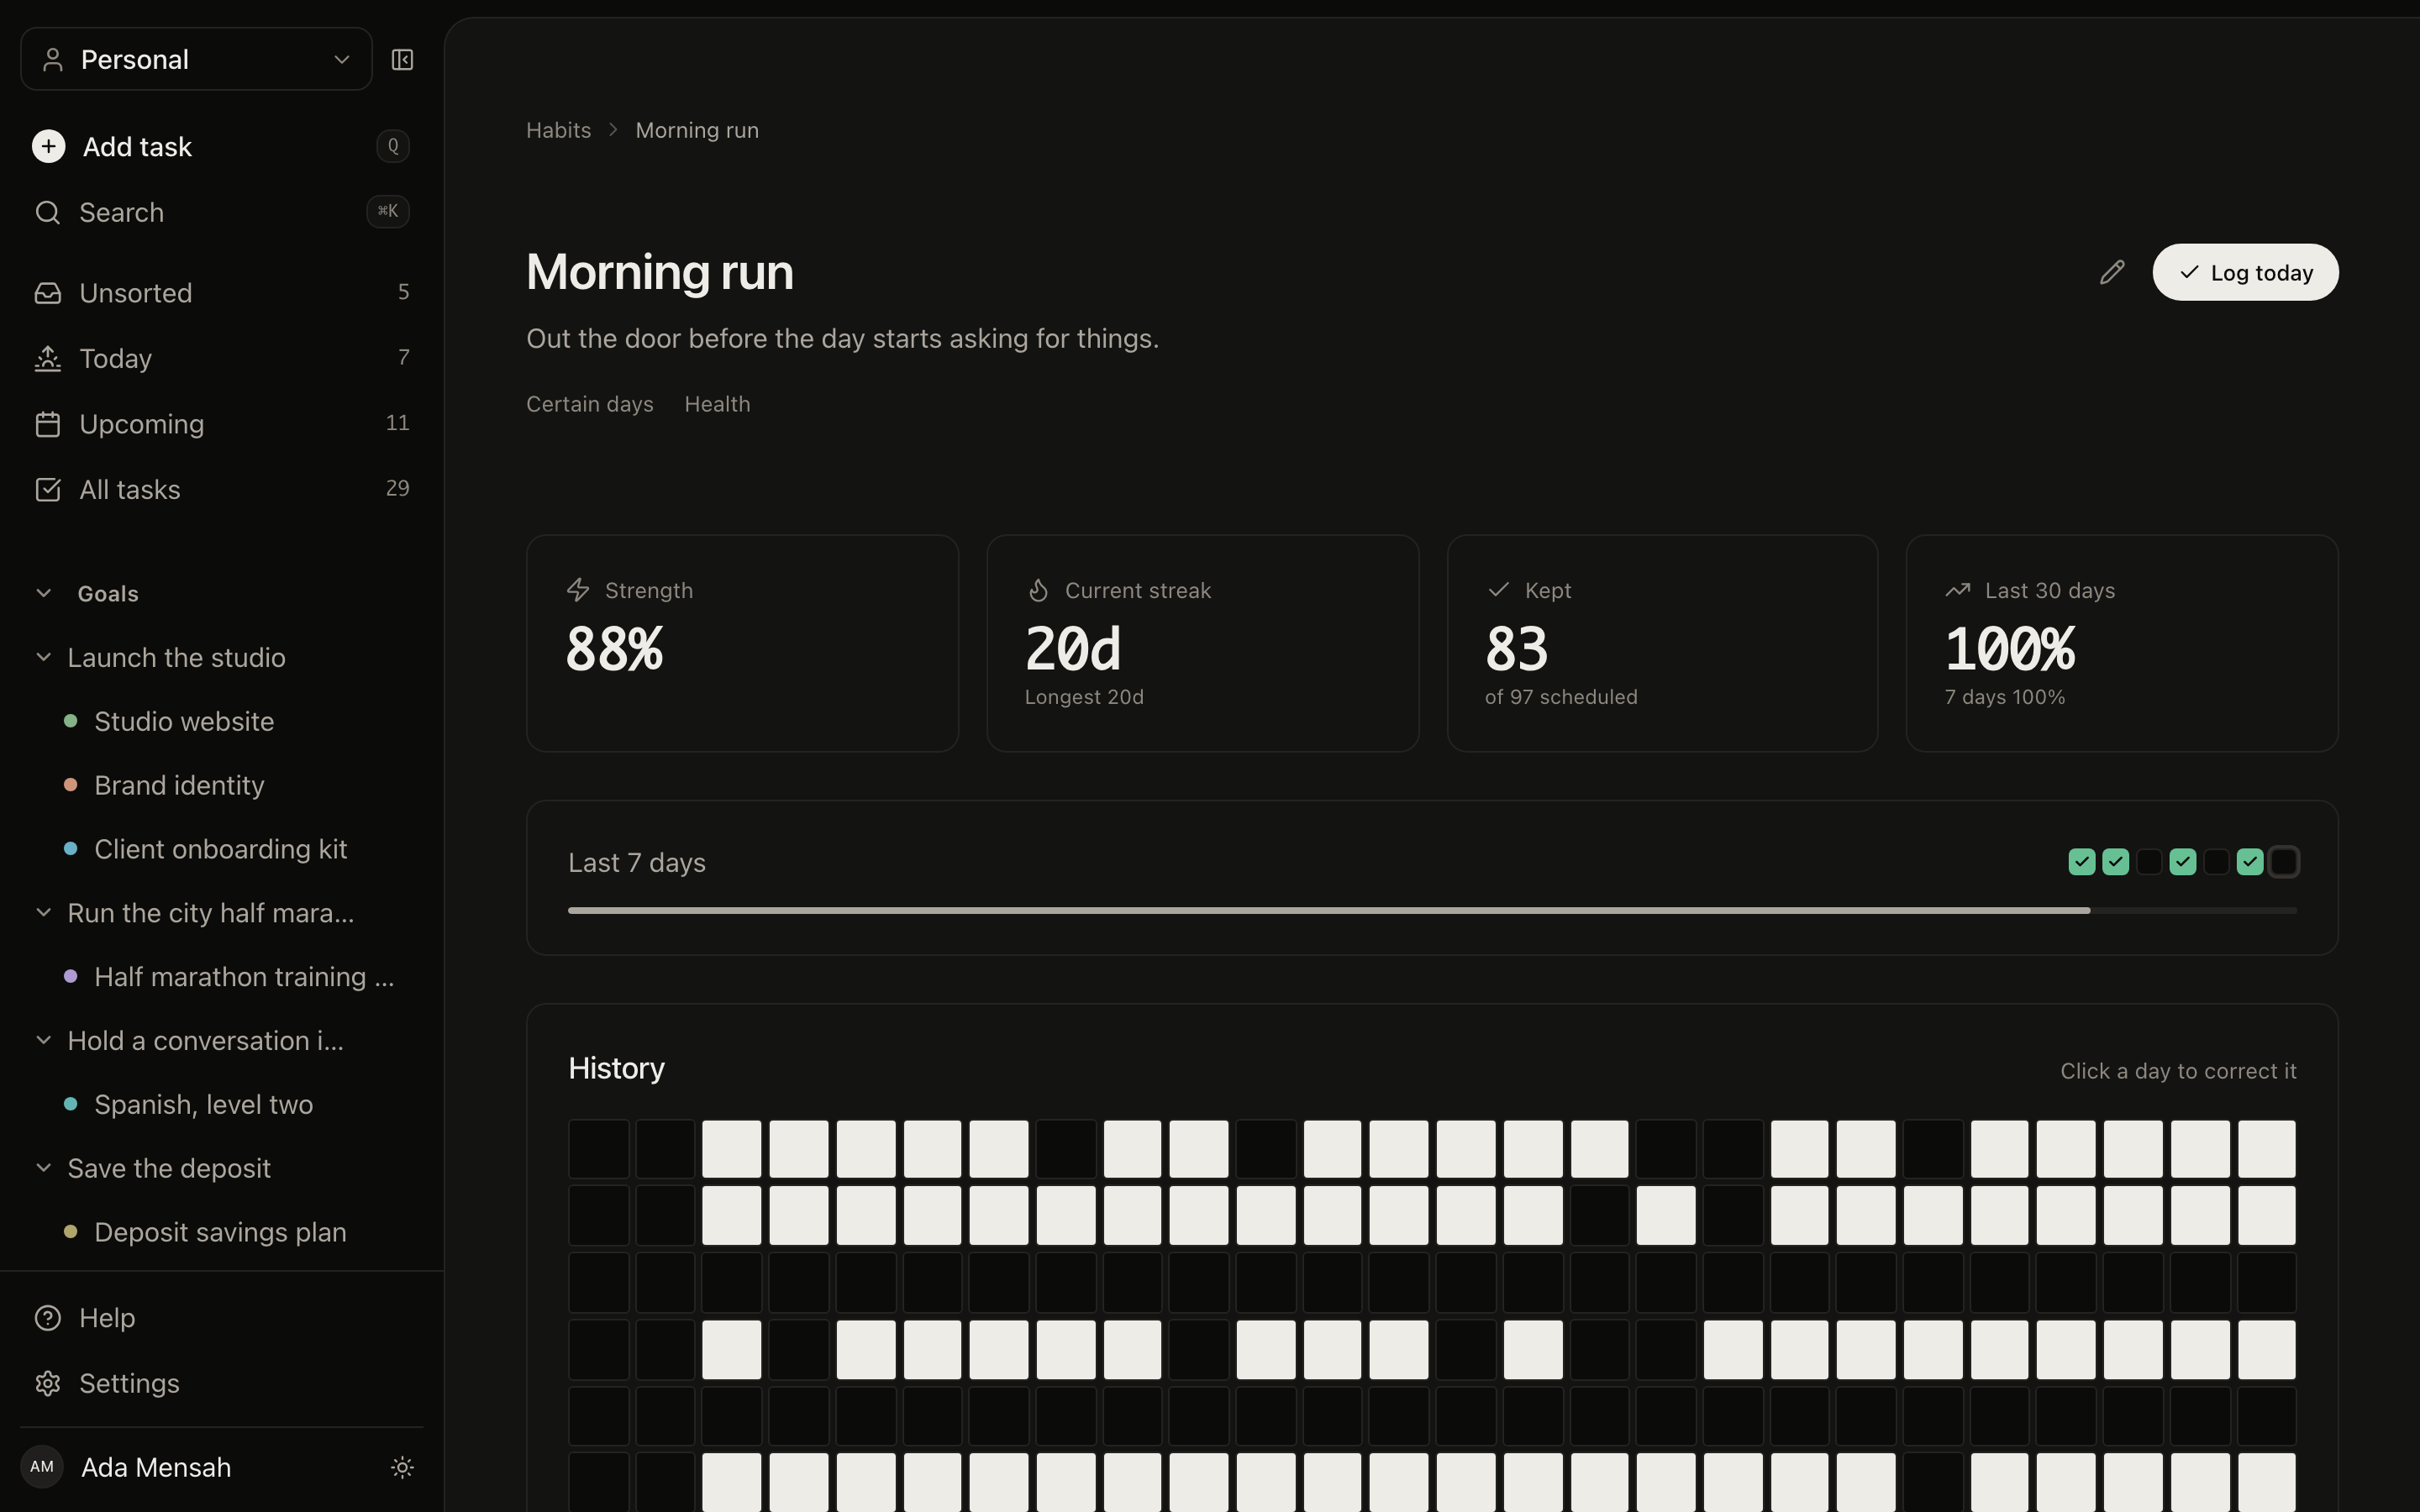
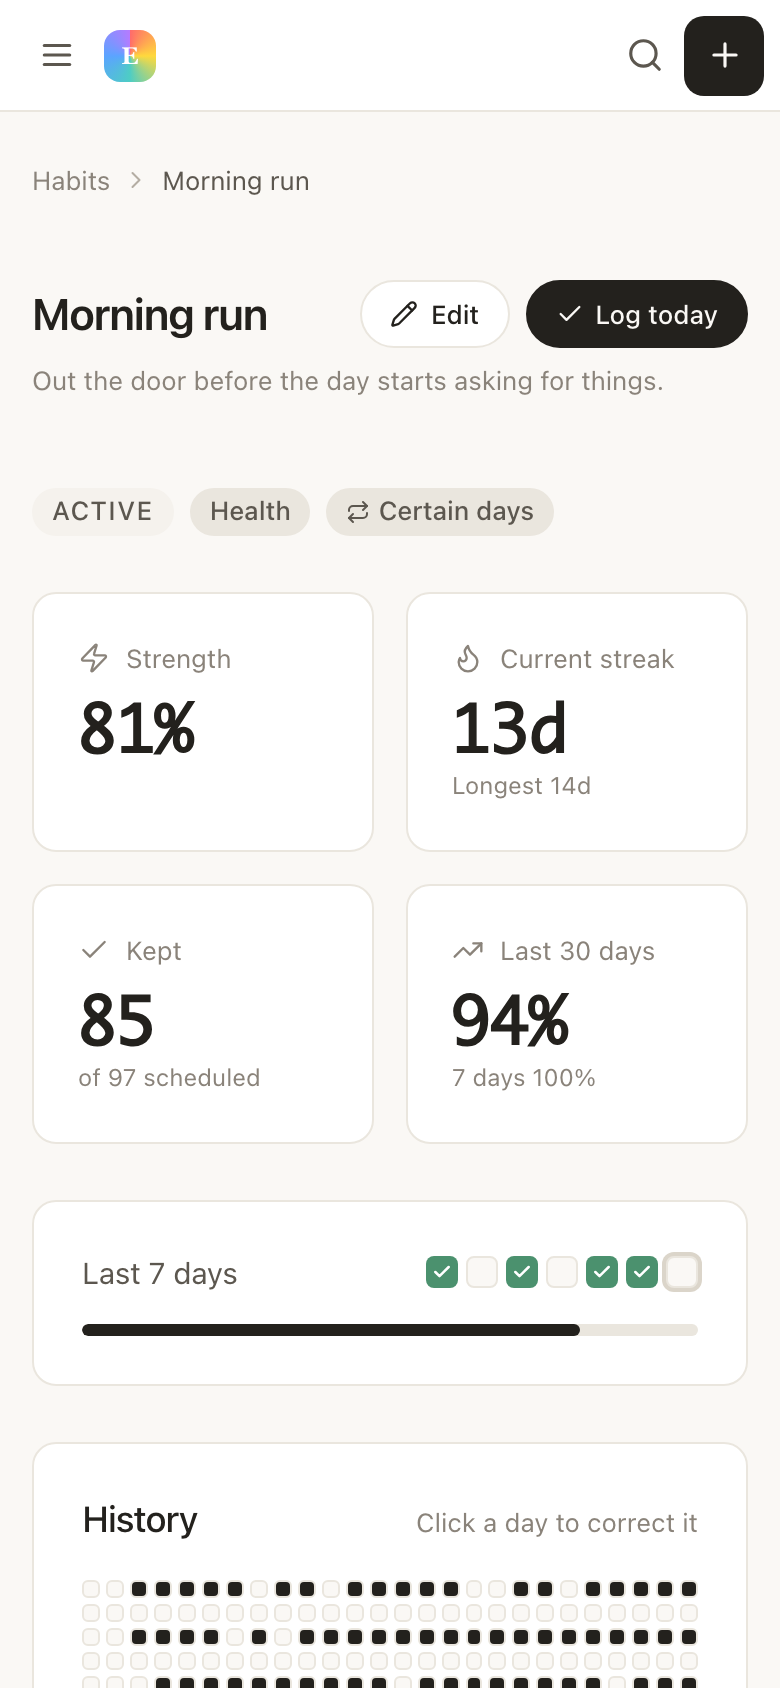
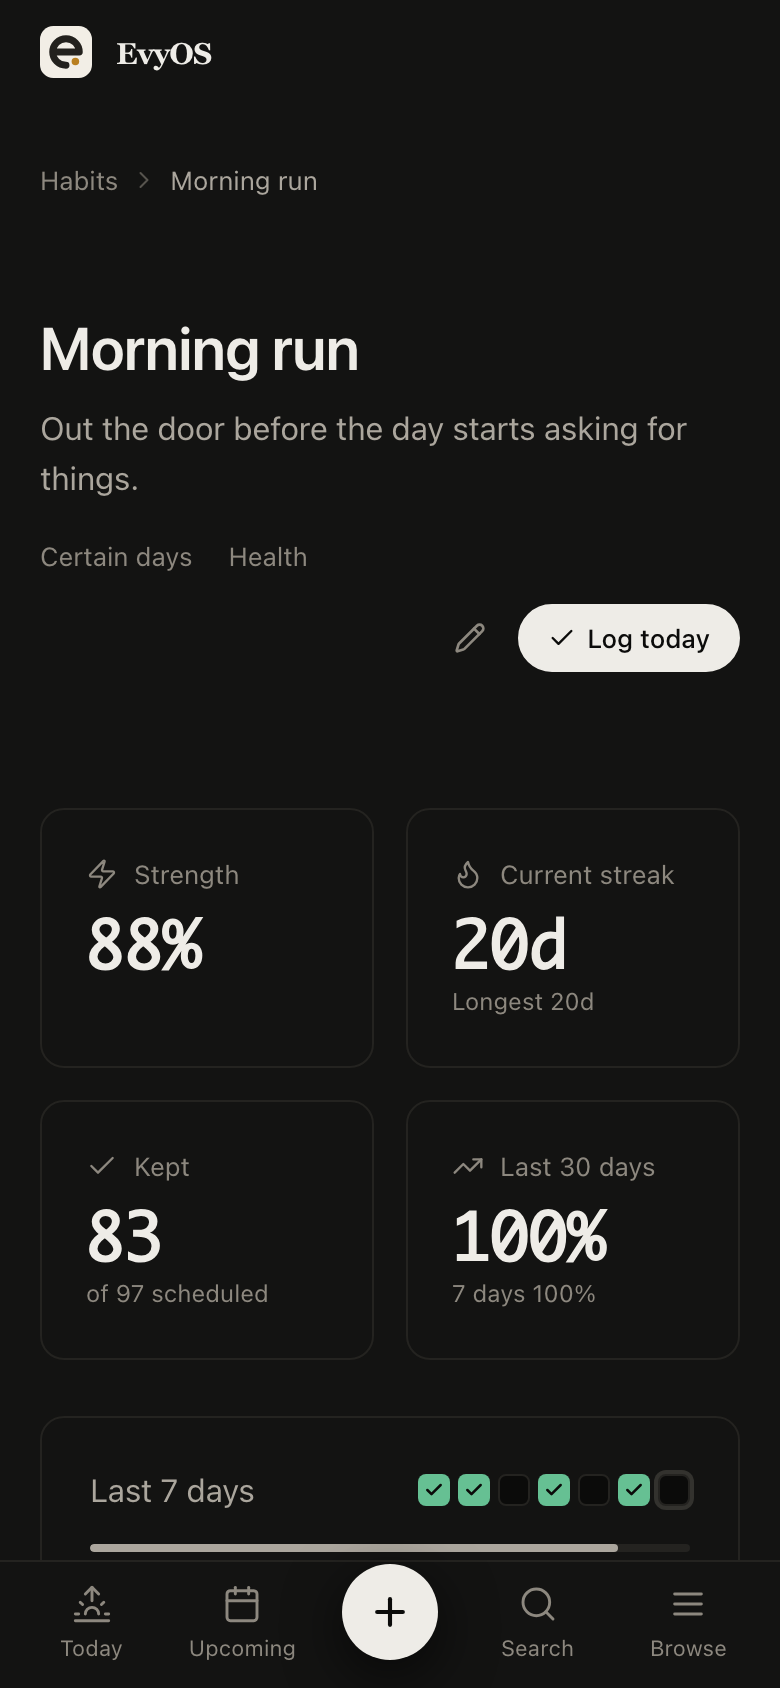
Every habit against the schedule you set for it, with streaks and completion history. A streak tells you about this week. Consistency tells you whether the habit is real.
Practice logged against a skill records minutes and the kind of session. Added up over a quarter, it separates the skills you worked on from the skills you meant to work on.
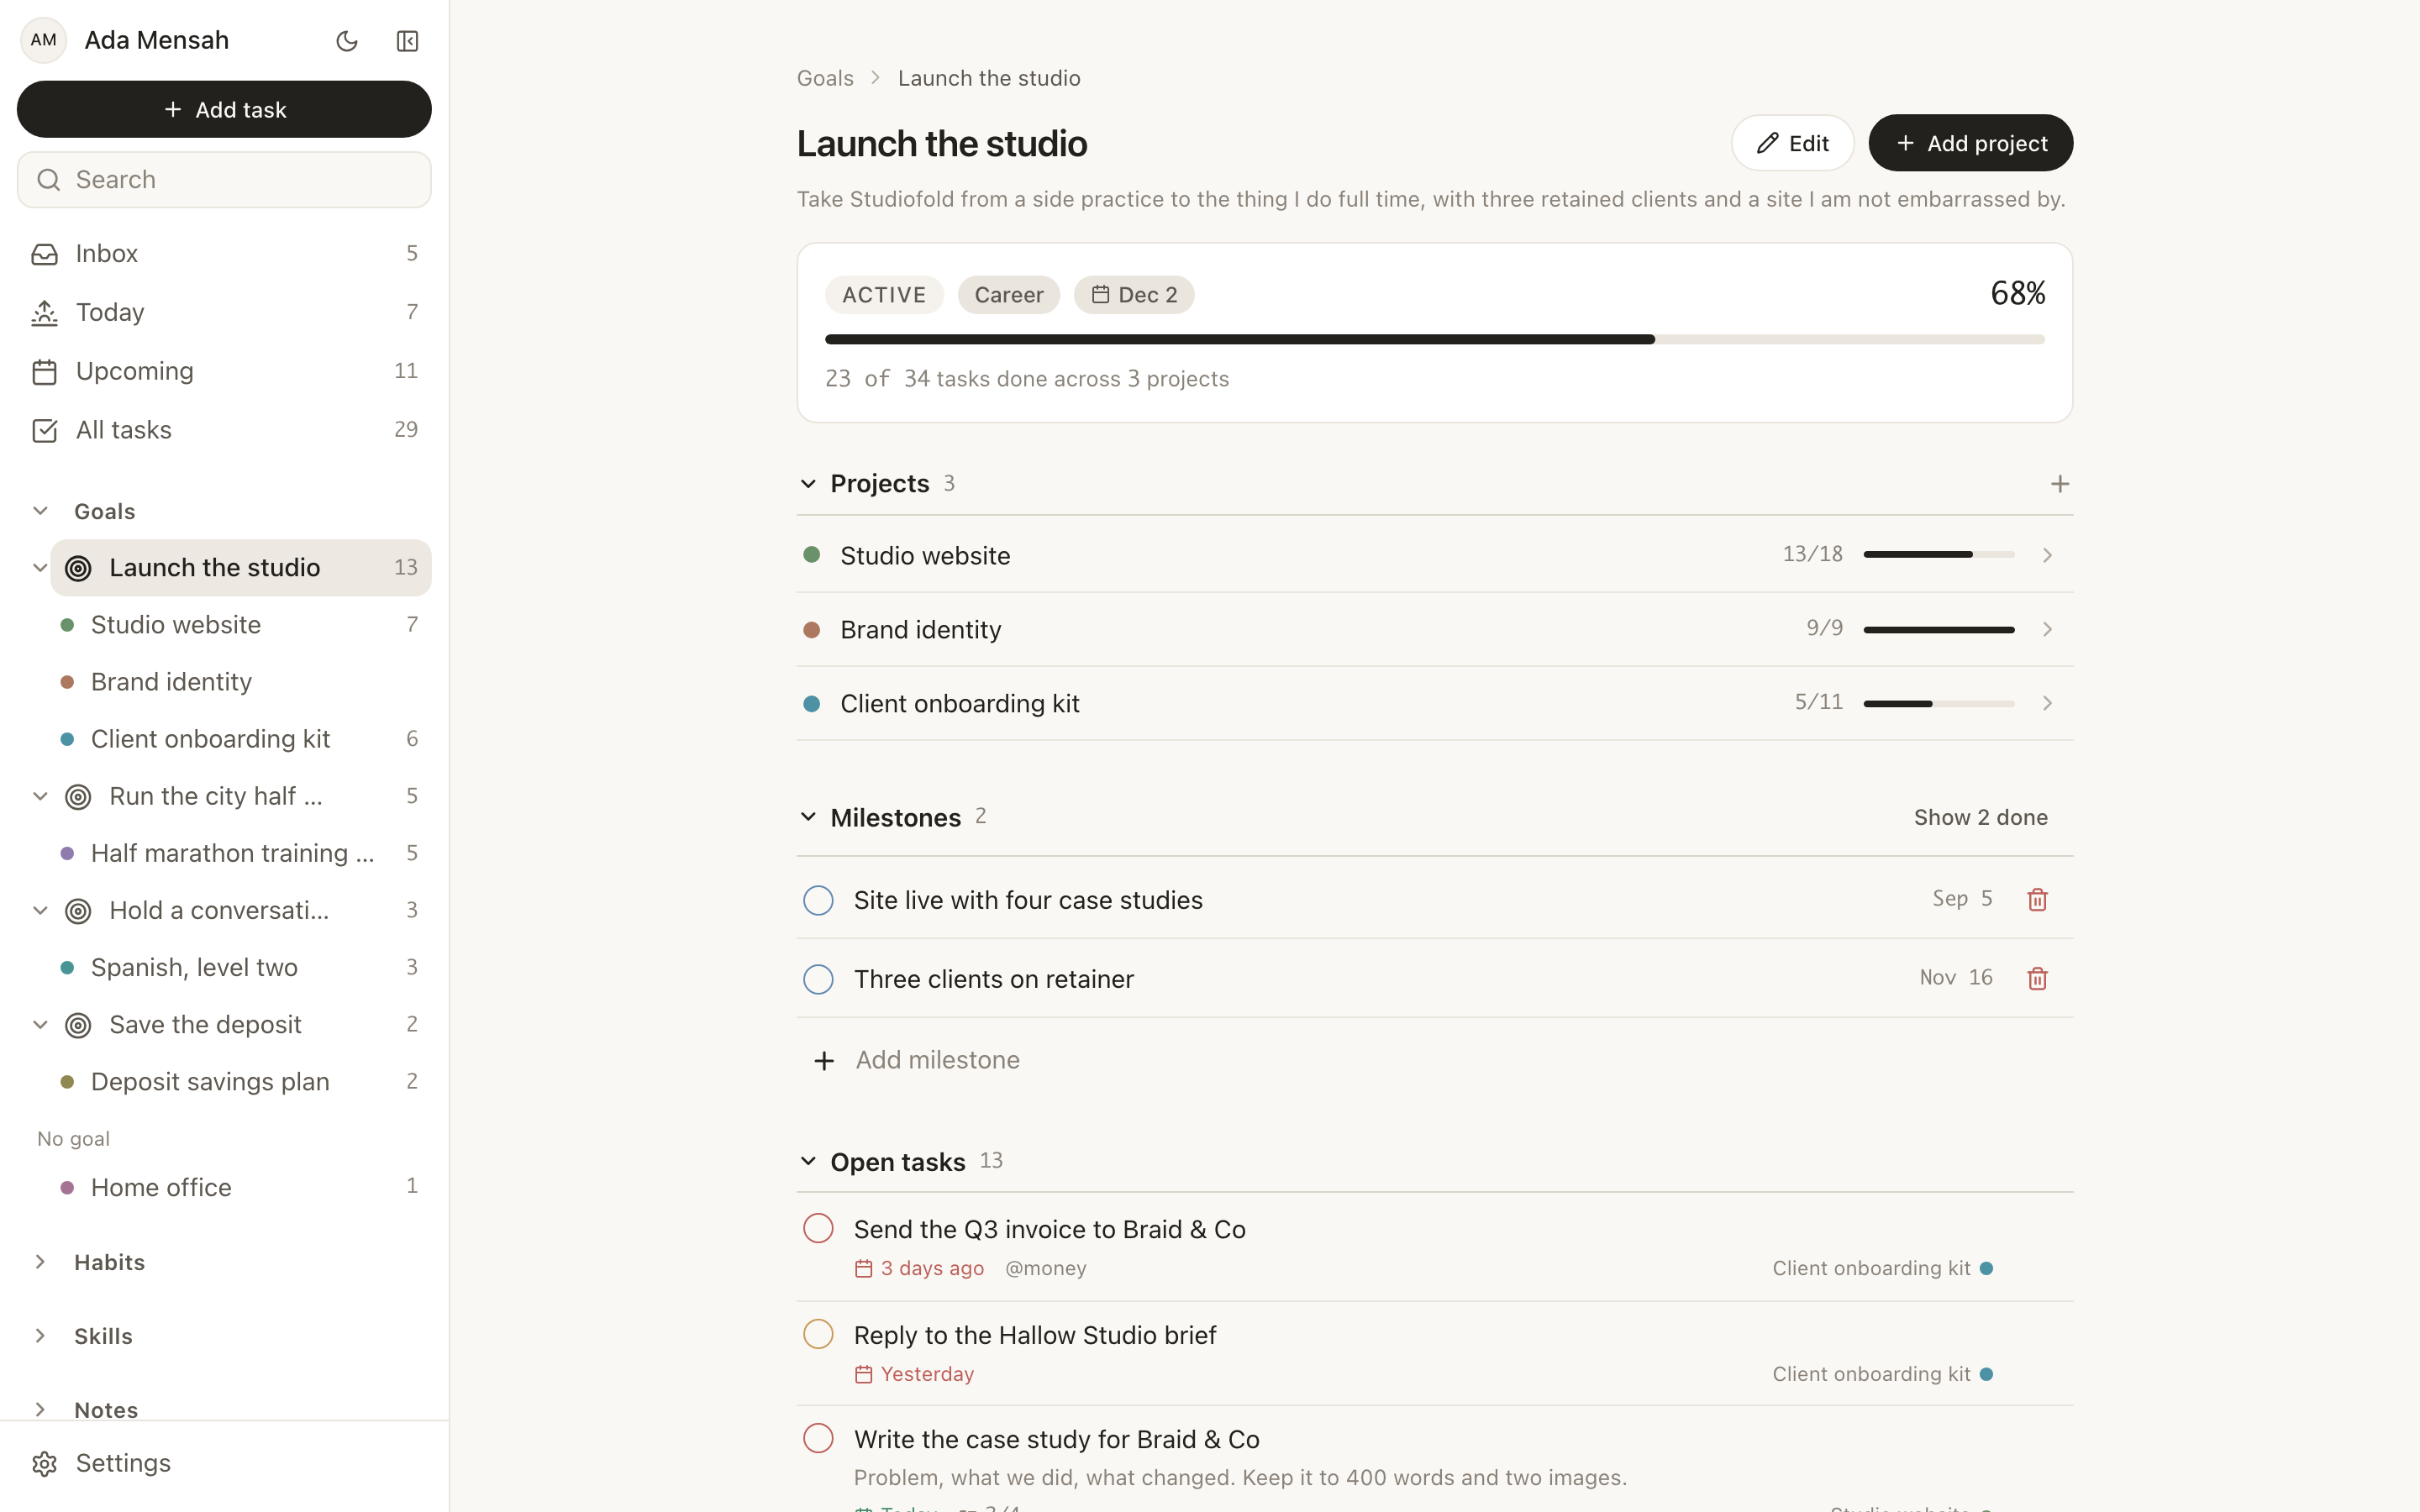
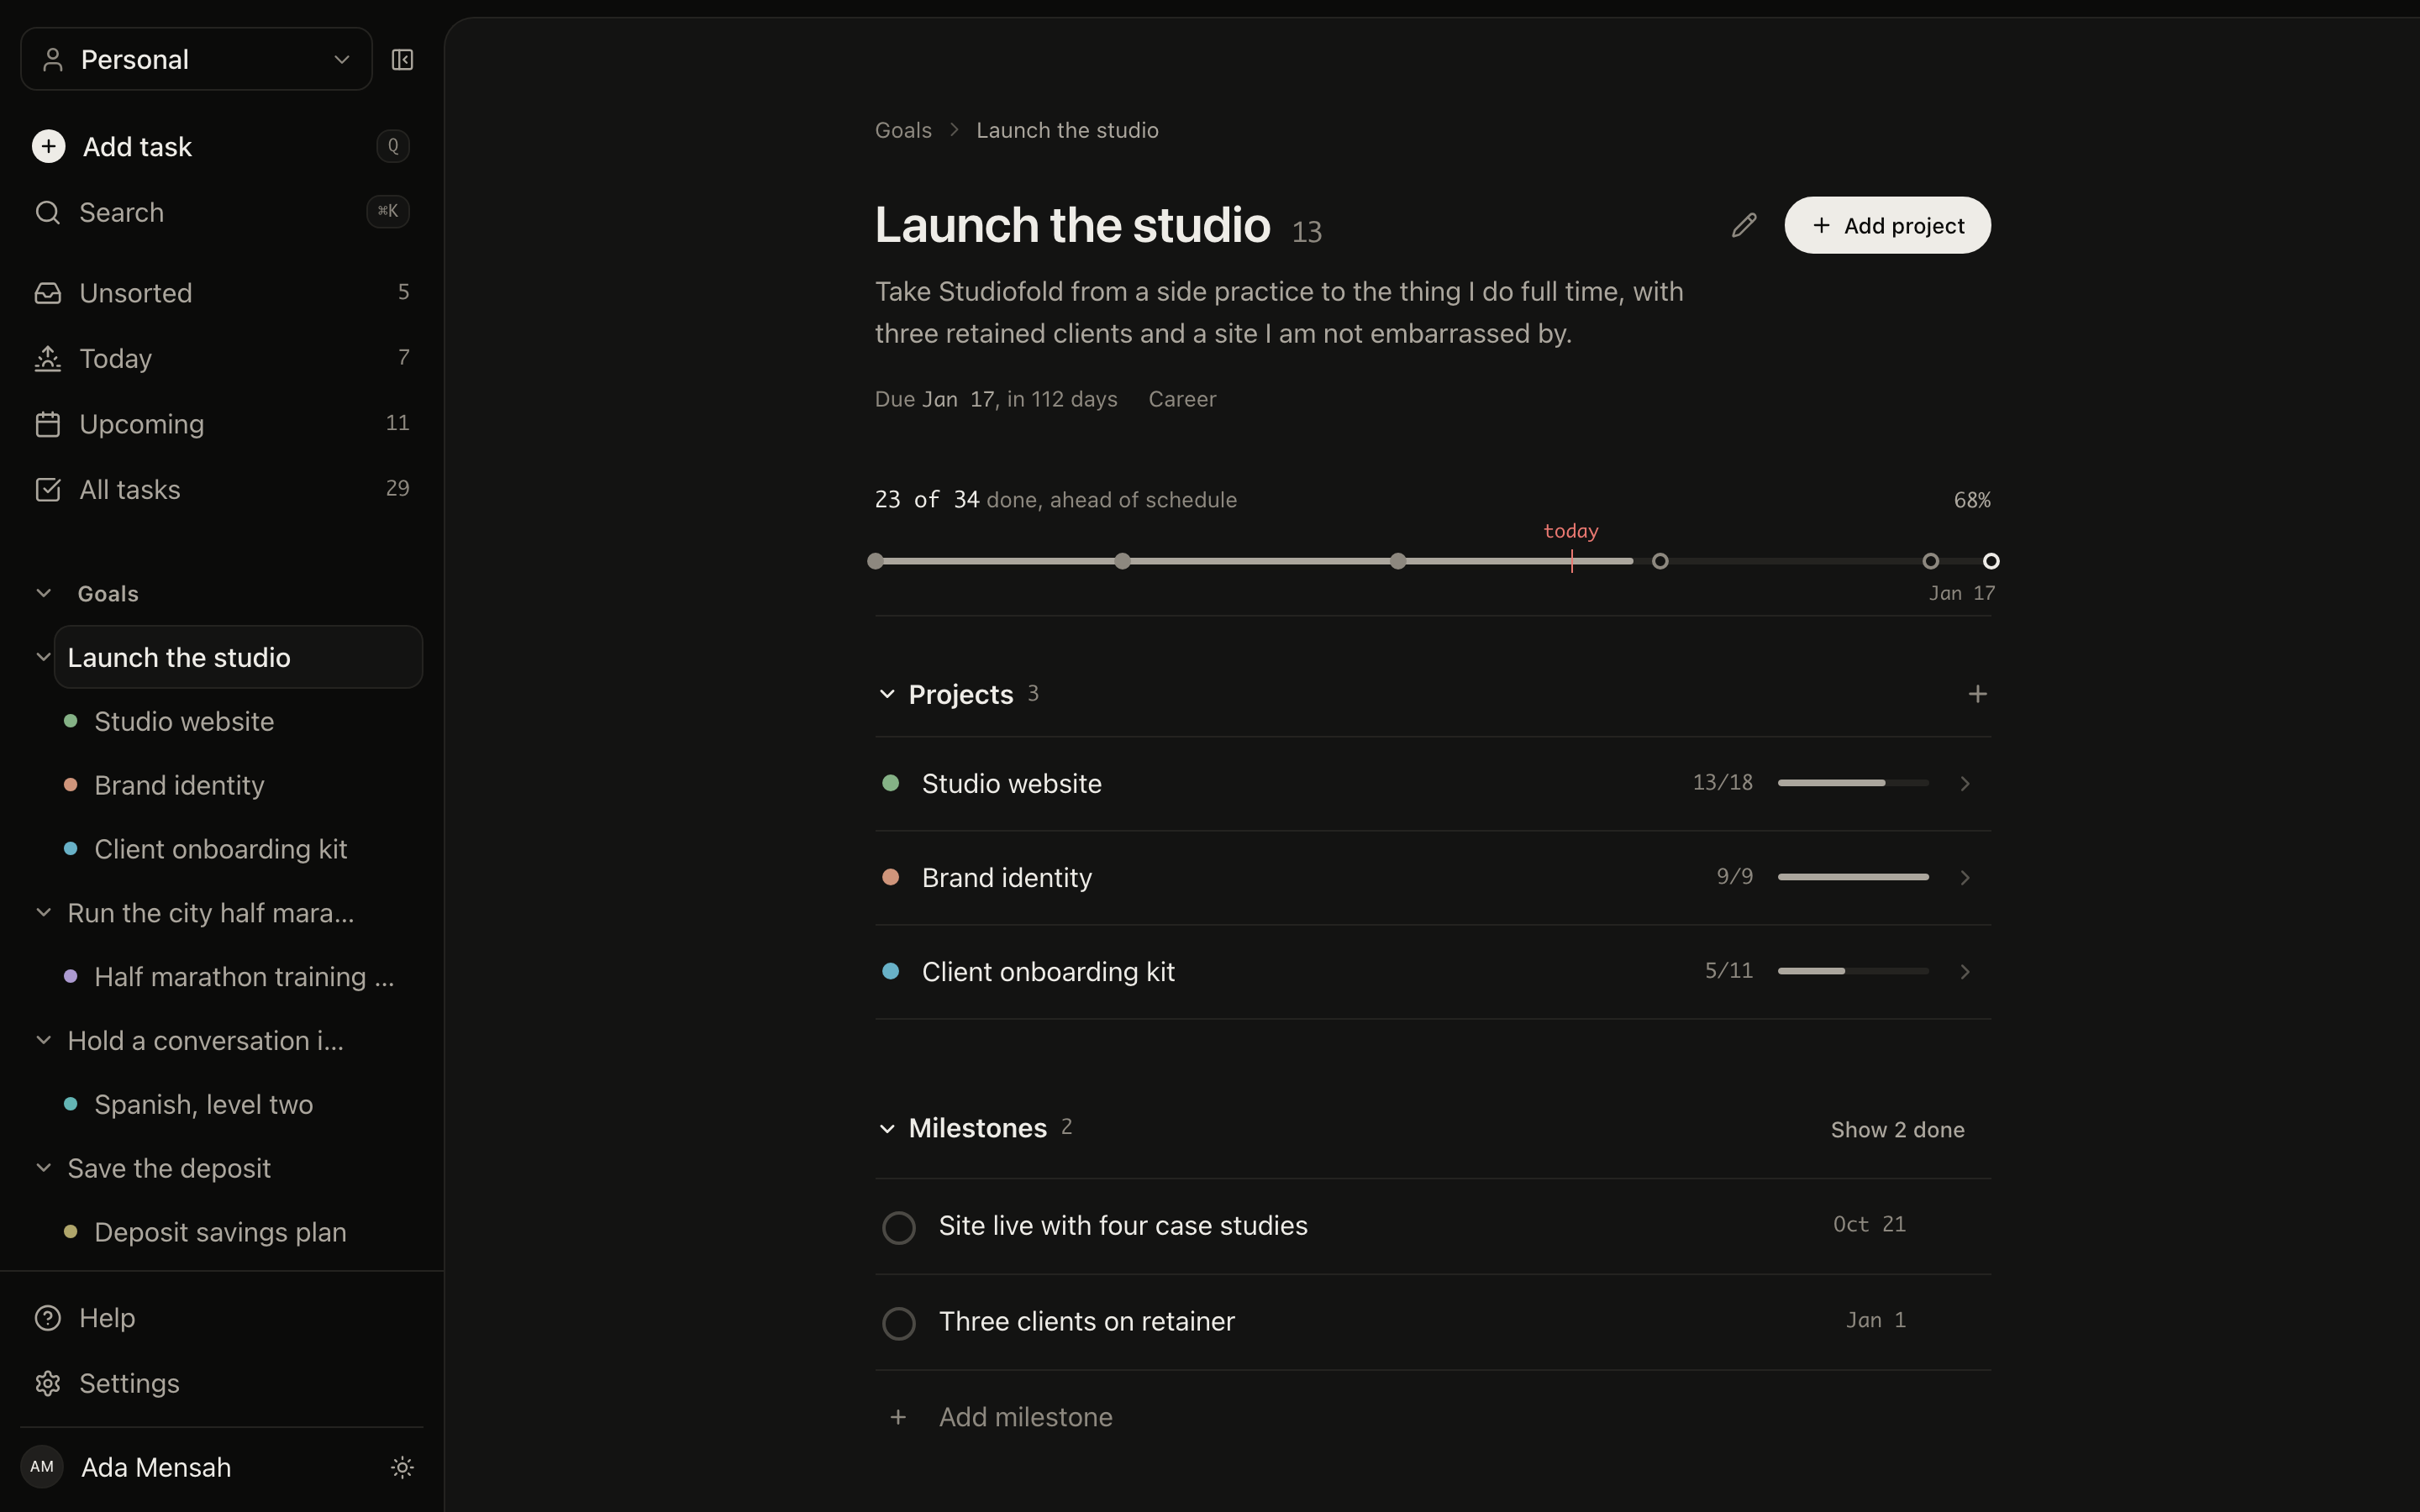
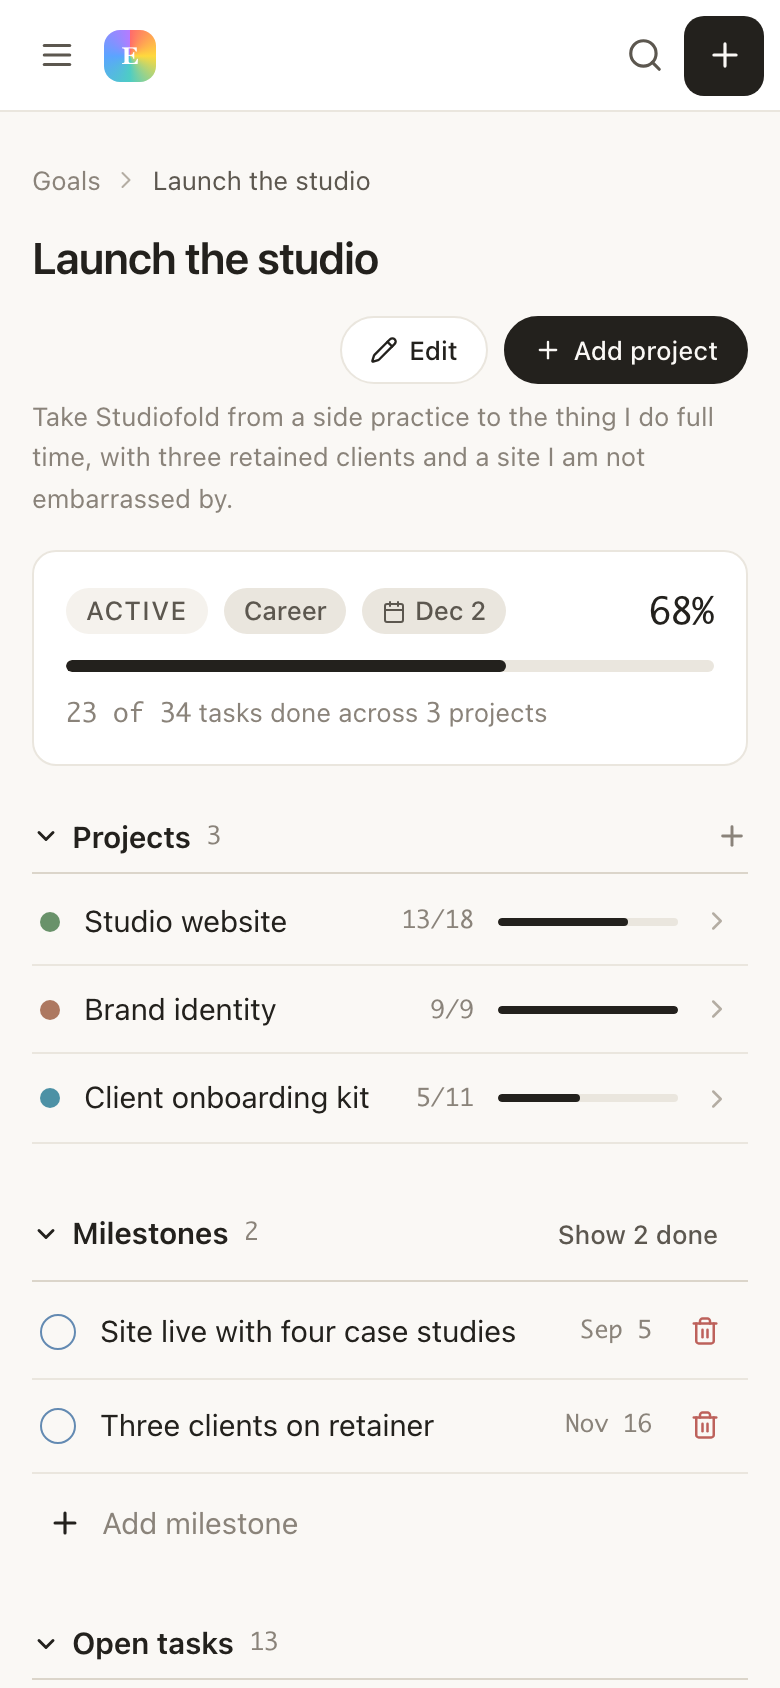
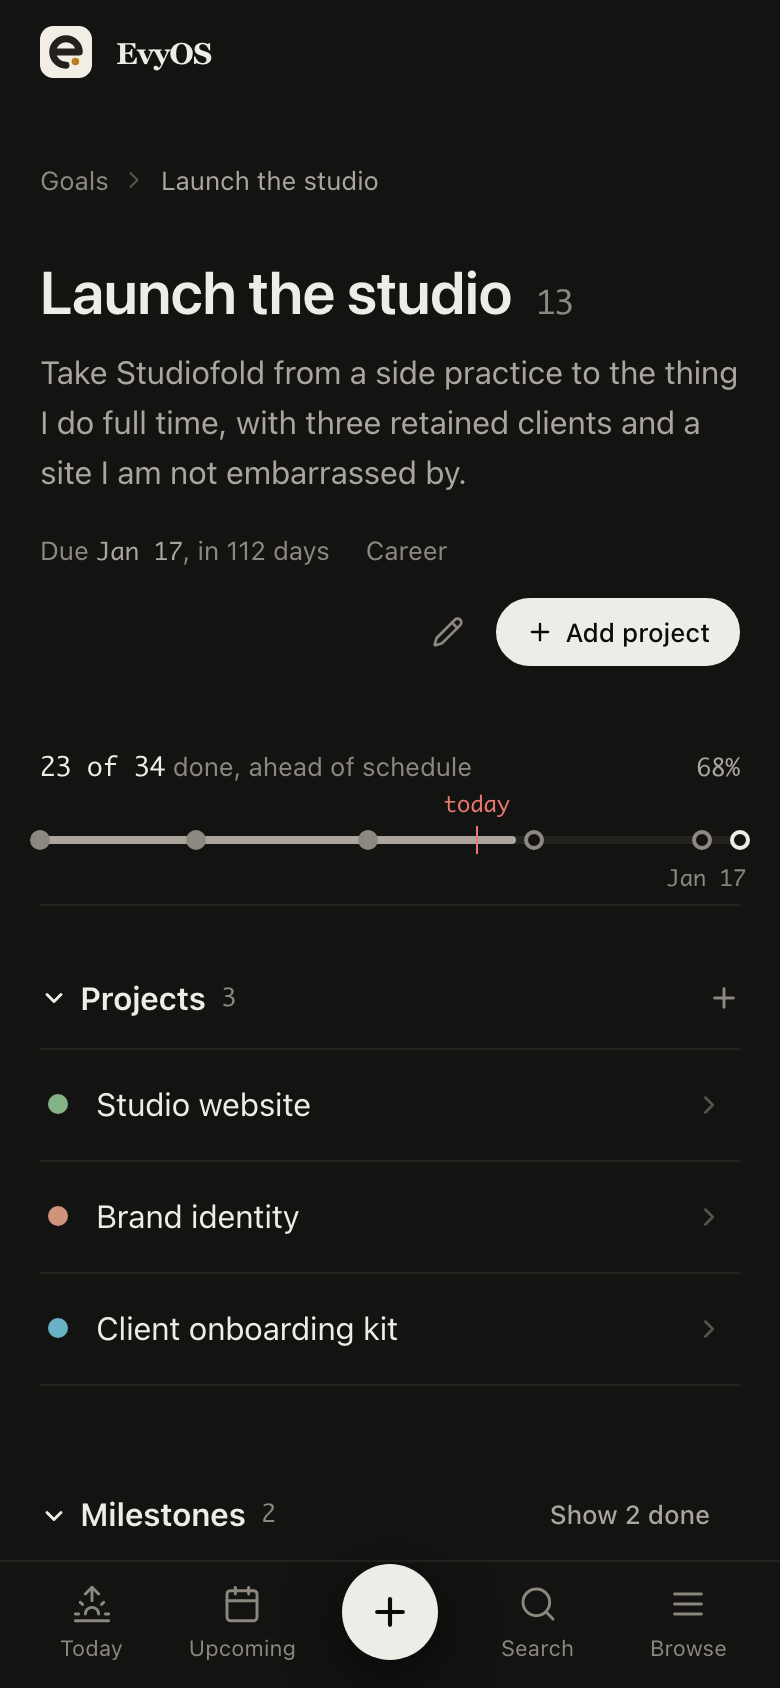
Progress calculated from finished work and completed milestones, not from a percentage you dragged. A goal nothing has laddered up to in 6 weeks says so.
What you finished, how the habits went and what moved, gathered into one place each week. Enough to hold a weekly review without spending the review assembling the facts.
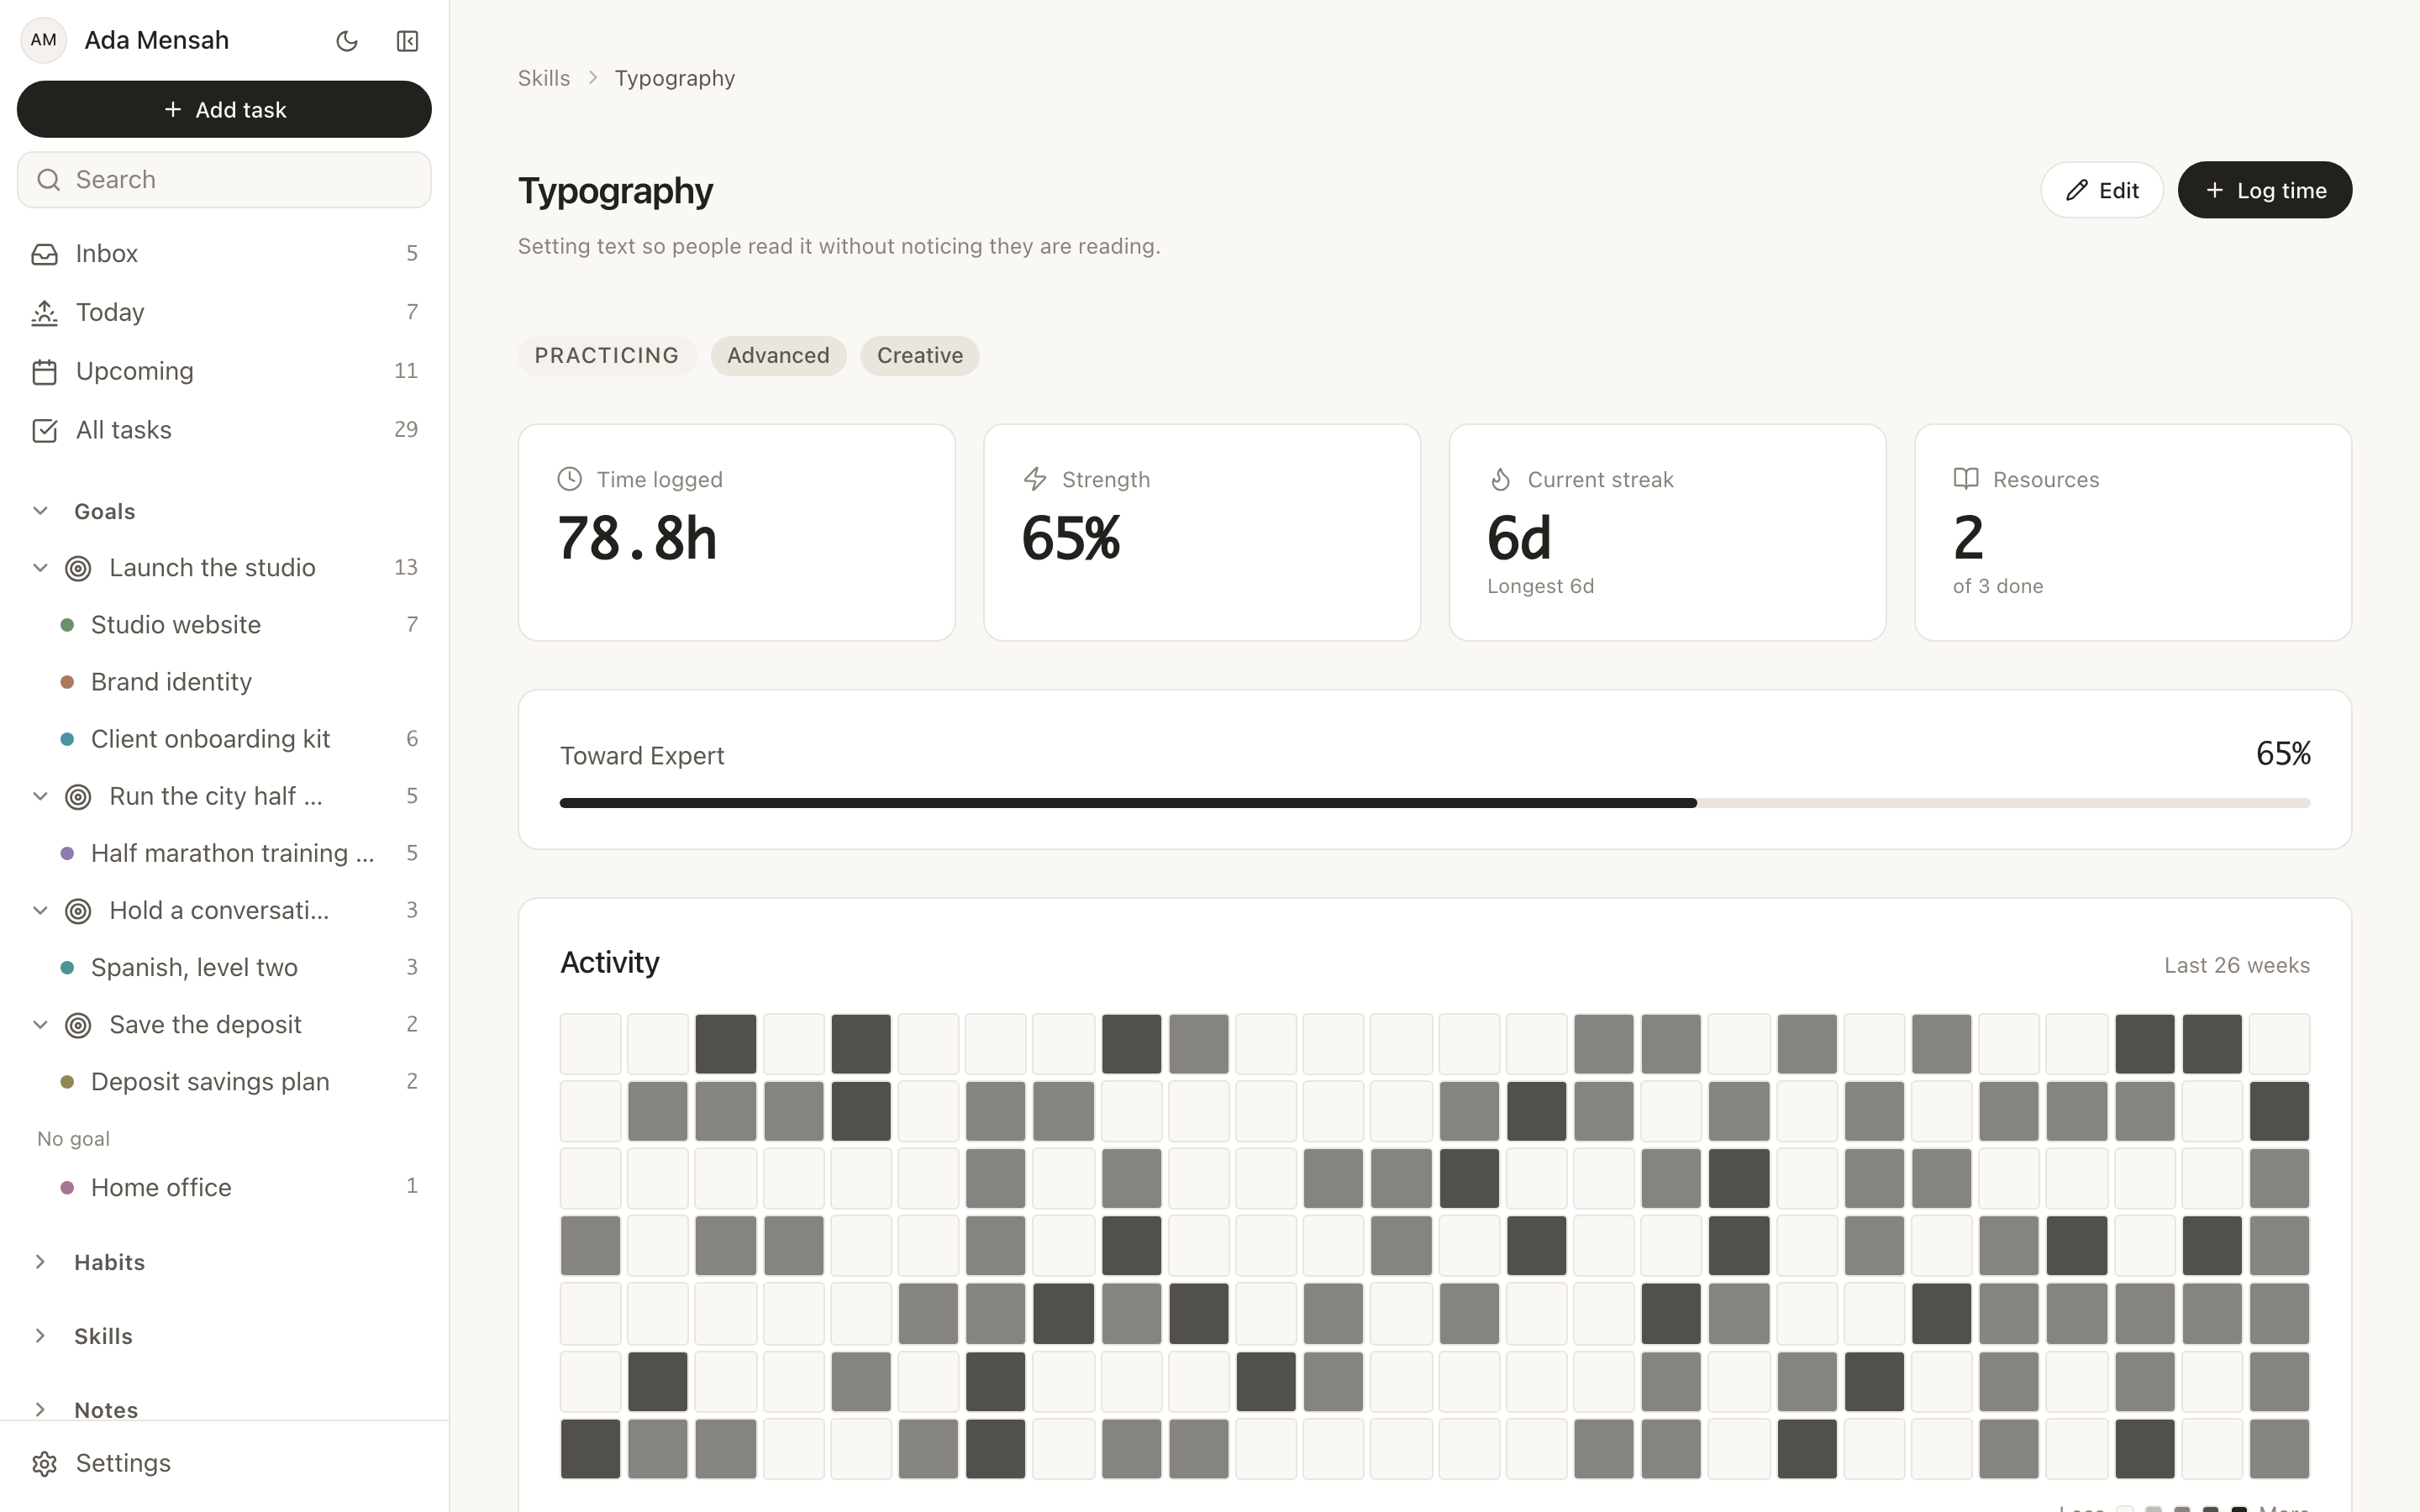
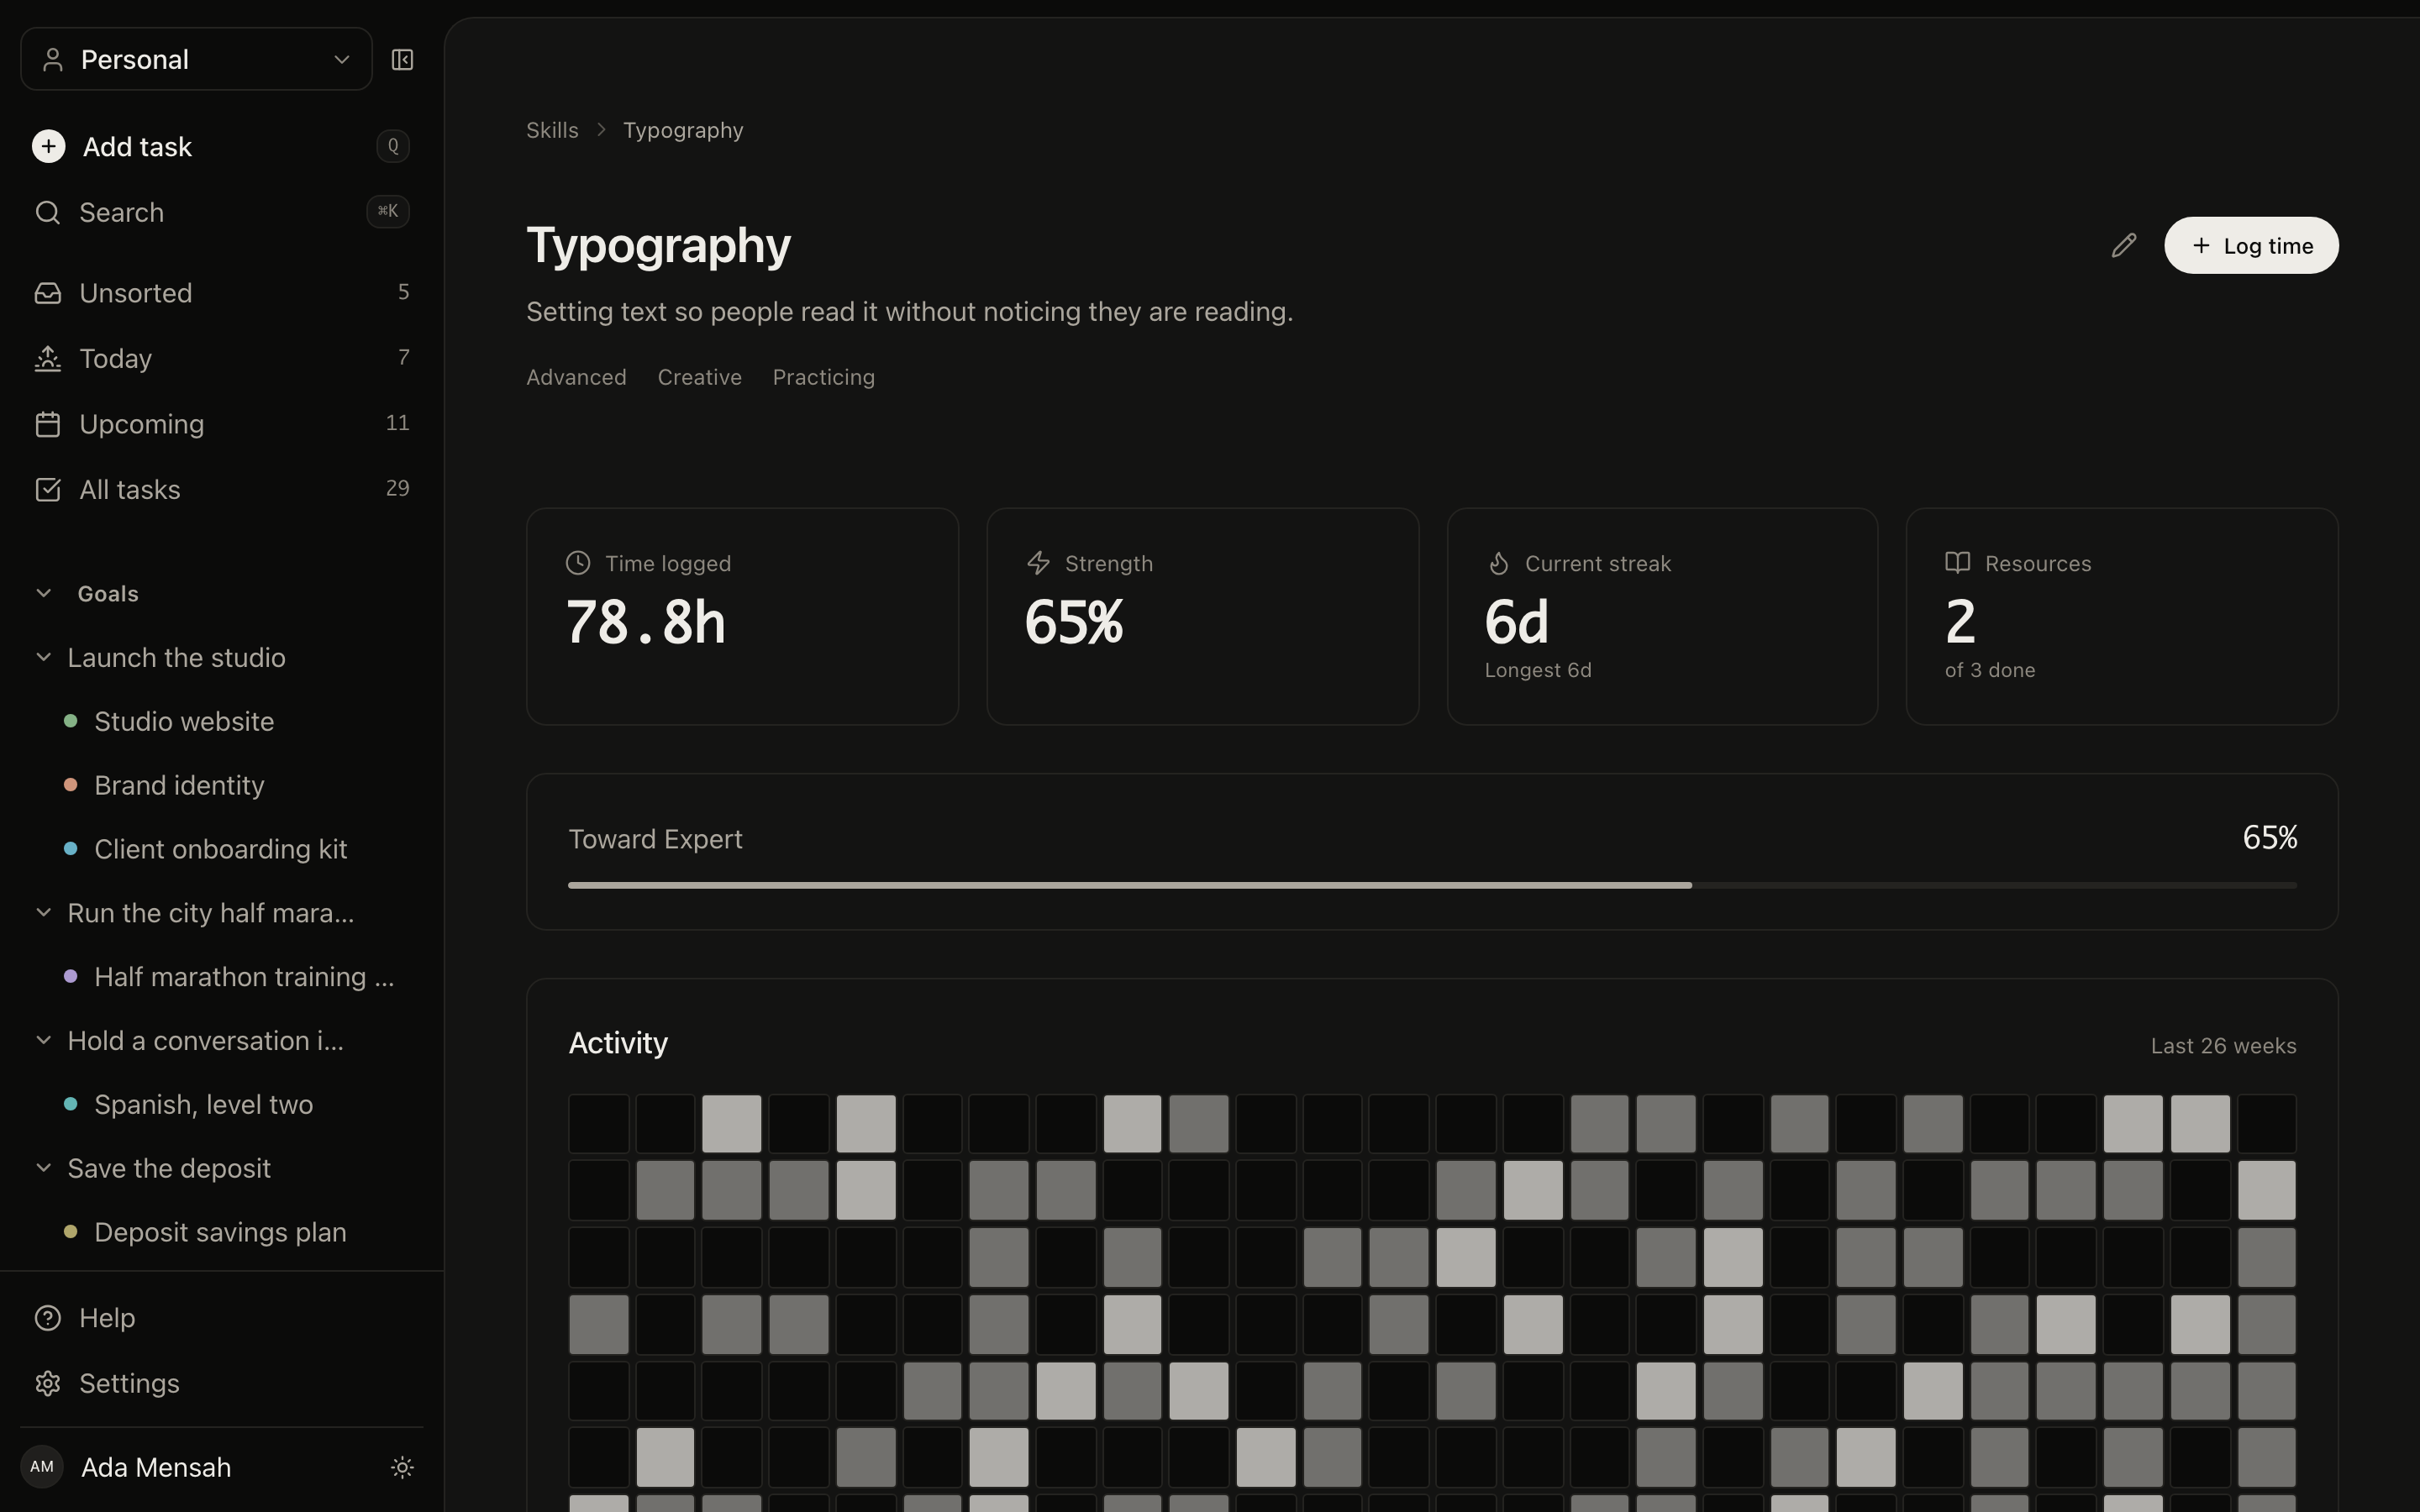
A year at a glance, one square per day. The clearest view of a long stretch of effort, and on the free plan like everything else here.
A streak is a fragile number. It is 41 on Tuesday and 0 on Wednesday, and it tells you nothing about the 3 months behind it. Every habit in EvyOS keeps its full completion history against its own schedule, so you can see the rate rather than the run, which is the number that survives one bad week and still tells the truth about a bad quarter.
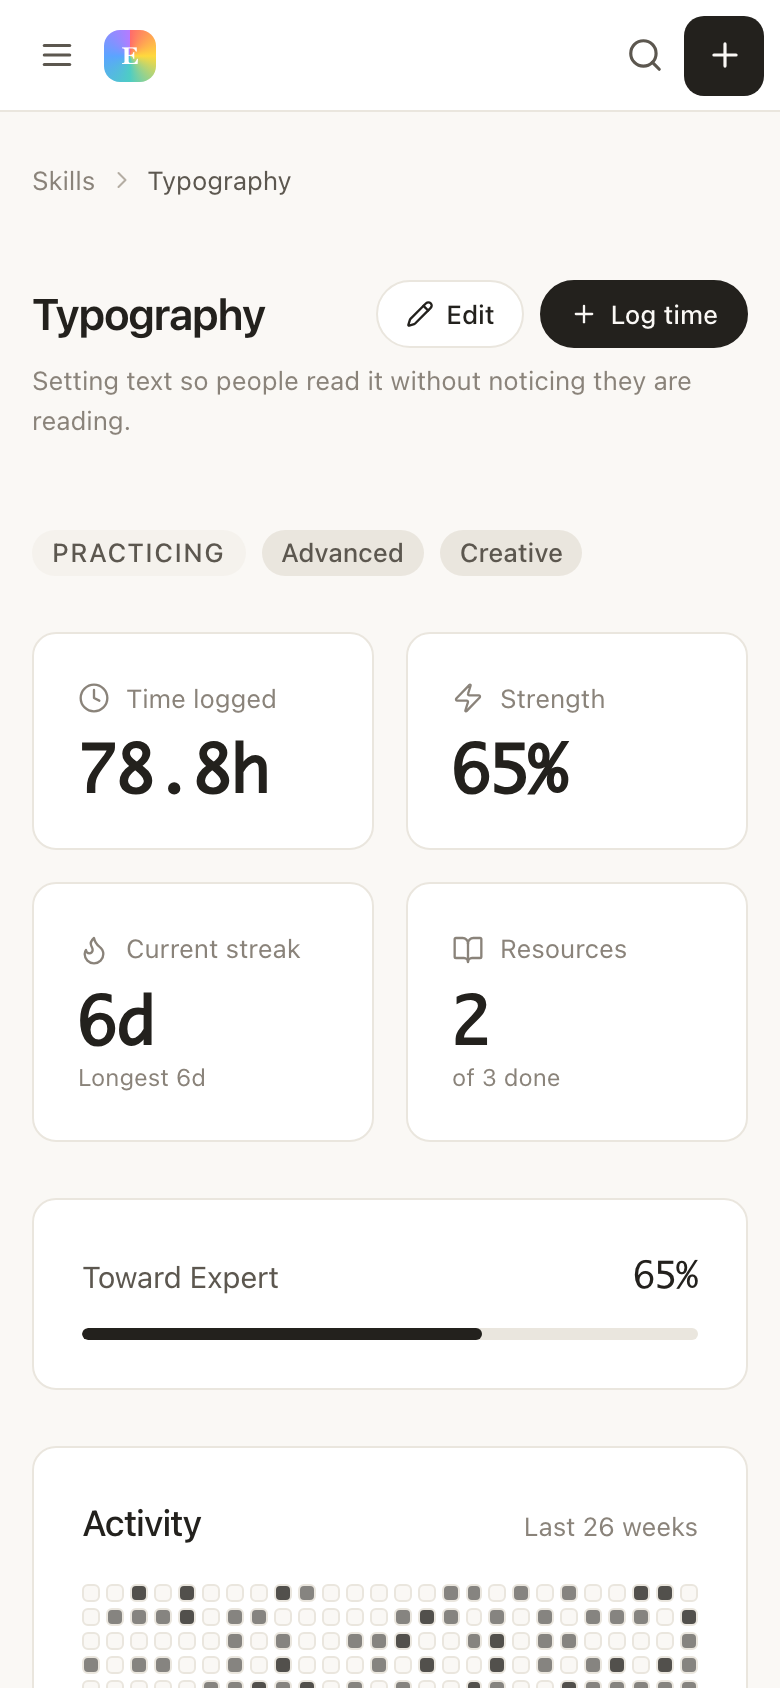
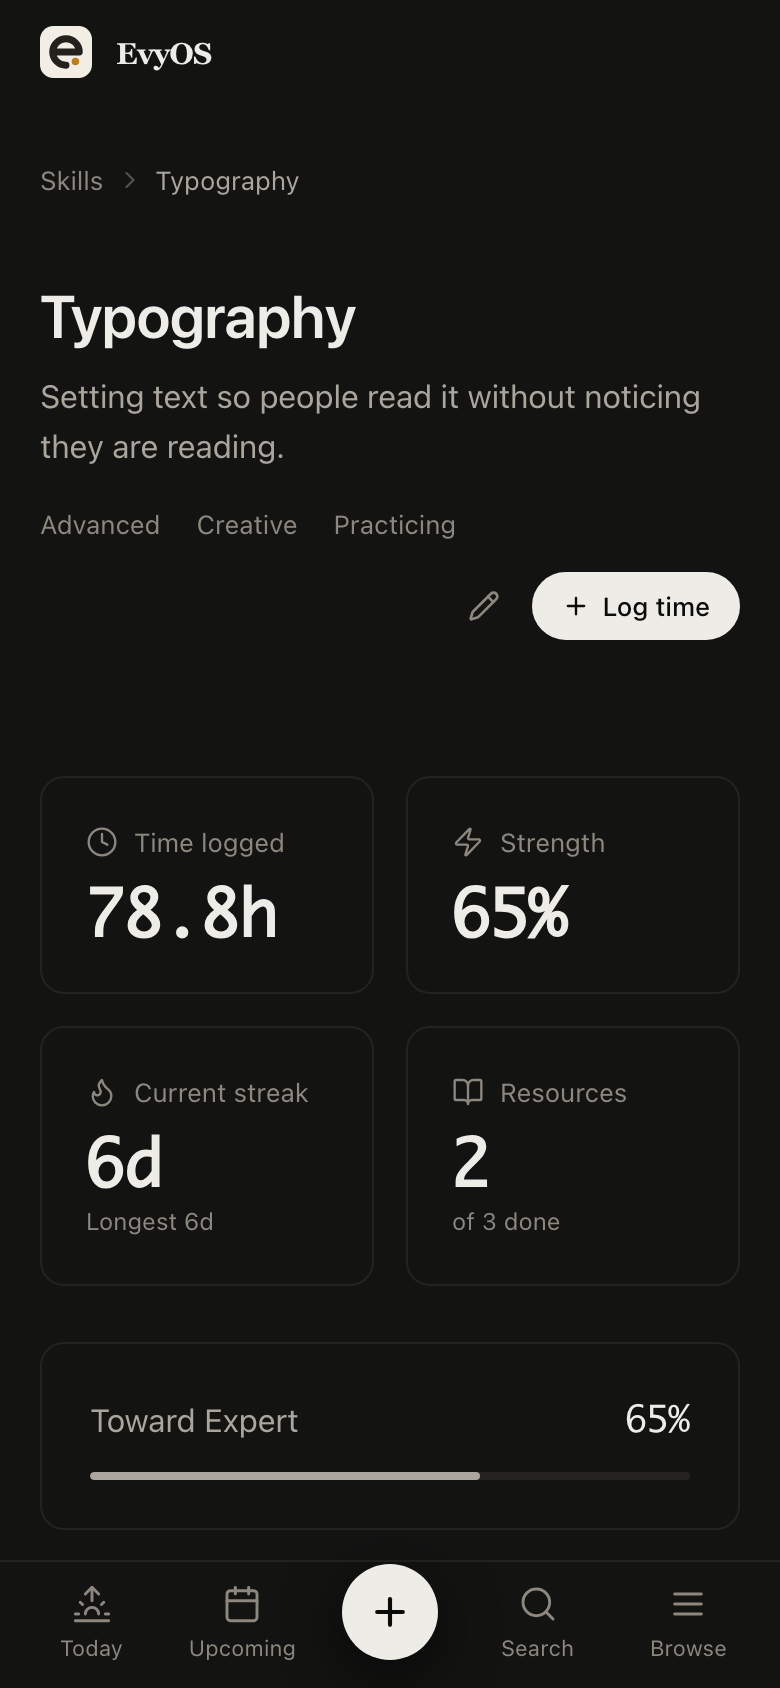
A skill in EvyOS accumulates logged practice: a date, the number of minutes, and what kind of session it was. Over a month that is a small habit. Over a year it is the most honest record you will have of what you were really working on, and it is usually a surprise. This is deliberate practice, not a billing timer.
Most goal trackers ask you how you are doing, which means they record your mood. Here a goal holds projects, a project holds tasks, and progress is calculated from what has actually been finished and which milestones have been reached. A goal with no projects under it, or projects nothing has moved on, shows up as exactly that.
Start with the weekly summary rather than the charts. It says what you finished, how the habits went and what moved, which is most of the review already done.
A habit whose consistency dropped, a goal nothing laddered up to, a skill that got no hours. The flat lines are the useful part; the good weeks need no decision.
Drop a habit that has not worked in 2 months, or move a project to the goal it is really serving. A review that changes nothing is a report, and reports get skipped.
These are personal productivity metrics. There is no client timesheet, no invoicing, no expenses and no revenue chart, and nothing here is designed to be shown to a manager. If you need to bill by the hour, use a time tracker built for it. What this answers is narrower and harder: whether the last 3 months went where you meant them to.
The dashboard is your own record of your own work. In a shared workspace you can see what the group has finished, but nobody is scored against anybody.
Nothing here needs maintaining. Every figure is derived from tasks, habits and practice you were logging anyway, which is why it is still accurate in month 6.
With the connector, on any plan, you can ask an AI assistant how the week went and have it read your actual records rather than guess.
The dashboard and the weekly summary come with the free plan, because a record of your own work is not a premium feature. Pro lifts the limits and adds shared workspaces.
See the plans →Keep the goals, tasks, habits and practice in one system and the dashboard is a side effect rather than another thing to maintain.
Start for free →